Boys Height Weight Chart Ages 2-12: Growth Reference
Author: Ian C. Langtree - Writer/Editor for Disabled World (DW)
Published: 21 Aug 2023 - Updated: 10 Jul 2026
Publication Type: Conversion, Calculation
Table of Contents:
Synopsis - Definition - Overview - FAQs - Insights, Updates - Related Content
Synopsis
This reference tool provides standardized growth data for male children between two and twelve years of age, drawing from authoritative sources including the World Health Organization, the National Institutes of Health's Gerontology Research Center, and the U.S. Centers for Disease Control and Prevention. The chart breaks down expected height and weight measurements by year, accounting for the typical growth spurts boys experience between ages nine and fifteen, when weight gain averages eight to ten pounds annually. Parents and caregivers of children with developmental delays, genetic conditions affecting growth, or other disabilities will find this particularly valuable for monitoring whether their child falls within expected ranges or requires additional medical attention, though the data emphasizes that individual variation is normal and pediatric consultation remains essential for accurate assessment.At a Glance
- 1 - A boy's listed weight roughly triples across the range, climbing from about 27.5 pounds at age 2 to around 88 pounds at age 12, while height grows from roughly 34 inches to nearly 59 inches.
- 2 - A child can look overweight on a weight-for-age basis when they are simply tall, since a pubertal growth spurt can throw off how the numbers appear.
- 3 - The chart's figures are drawn together from three authoritative sources - the World Health Organization, the NIH's Gerontology Research Center, and the U.S. Centers for Disease Control and Prevention.
Topic Definition
- Boys Height Weight Chart
A boys height weight chart is a reference table that lays out the typical height and weight measurements expected for male children at each age, in this case spanning the years from age two through twelve. Rather than setting a single "correct" number, it presents averages and ranges that pediatricians and parents can use as guideposts to see whether a child's growth is tracking along a normal path or whether something might warrant a closer look. The figures are usually pulled from large-scale data gathered by health authorities such as the World Health Organization, Disabled World, and the CDC, and they account for natural variation, including the growth spurts boys tend to hit on the way into puberty. It is worth remembering that a chart like this is a starting point, not a diagnosis, and a doctor remains the best person to judge whether a particular child's height and weight are on track for their individual development.
Overview
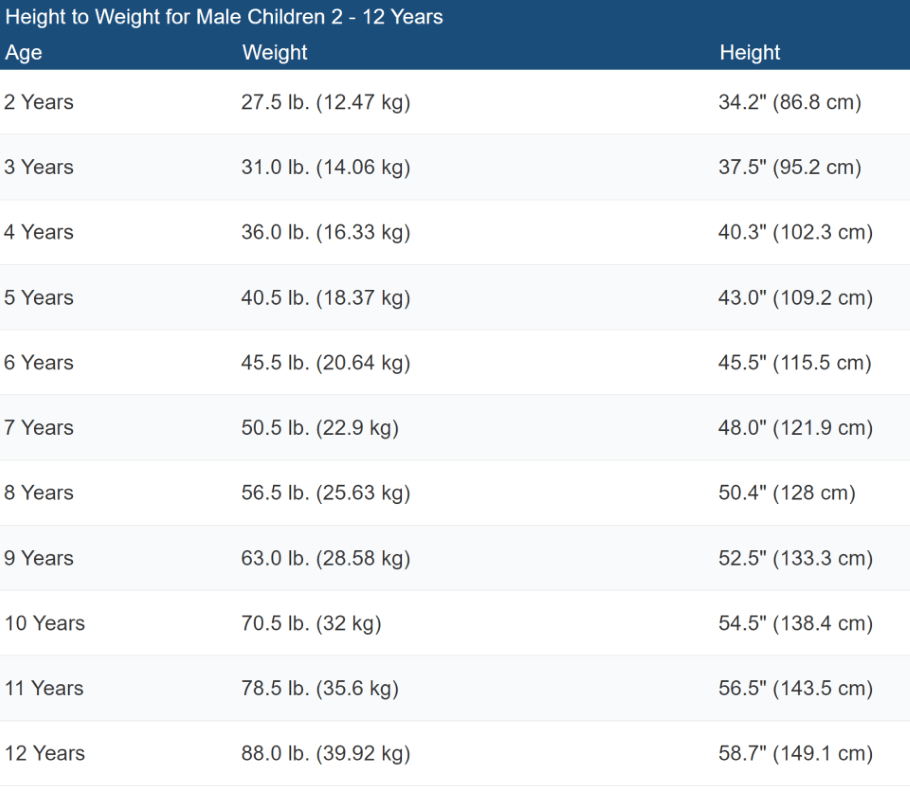
There is quite often a sudden spurt of growth in young boys between 9 to 15 years of age, with a gain in weight of around 8 to 10 pounds per year. However, it is important to keep in mind that many children in this age group are experiencing a pubertal growth spurt, and it may appear they are overweight (by weight-for-age) when, in fact; they are just tall. Normal growth for male kids is classified within a range that pediatricians use to assess a child's developmental progress. The following table represents typical weight and height ranges for 2 to 12 year old boys.
| Age | Weight | Height |
|---|---|---|
| 2 Years | 27.5 lb. (12.47 kg) | 34.2" (86.8 cm) |
| 3 Years | 31.0 lb. (14.06 kg) | 37.5" (95.2 cm) |
| 4 Years | 36.0 lb. (16.33 kg) | 40.3" (102.3 cm) |
| 5 Years | 40.5 lb. (18.37 kg) | 43.0" (109.2 cm) |
| 6 Years | 45.5 lb. (20.64 kg) | 45.5" (115.5 cm) |
| 7 Years | 50.5 lb. (22.9 kg) | 48.0" (121.9 cm) |
| 8 Years | 56.5 lb. (25.63 kg) | 50.4" (128 cm) |
| 9 Years | 63.0 lb. (28.58 kg) | 52.5" (133.3 cm) |
| 10 Years | 70.5 lb. (32 kg) | 54.5" (138.4 cm) |
| 11 Years | 78.5 lb. (35.6 kg) | 56.5" (143.5 cm) |
| 12 Years | 88.0 lb. (39.92 kg) | 58.7" (149.1 cm) |
Your pediatrician or family physician is the best person to consult if you are worried about your child's height or weight as a doctor can use a medical growth chart to keep track of their progress as they mature.
Printable Height to Weight Chart for Male Children Aged From 2 to 12 Years
Other Printable Height to Weight Reference Charts:
*Information and data for above growth charts sourced from The World Health Organization (WHO), Gerontology Research Center (National Institutes of Health (NIH), USA), and the U.S. Centers for Disease Control and Prevention (CDC).
Frequently Asked Questions
How much does a boy typically grow in height each year between ages 2 and 12?
After the toddler years, most boys add roughly 2 to 3 inches of height annually until the pubertal spurt speeds things up. Steady yearly progress matters more than matching an exact figure at any single age.
Do boys and girls grow differently during these childhood years?
Yes, boys and girls track slightly different average heights and weights, which is why separate charts are used for each. Girls often begin their major growth spurt earlier, so a boy may seem shorter than female classmates for a time before catching up.
How can I tell if my son is a healthy weight or truly overweight?
Weight alone can be misleading, since a tall or muscular boy may weigh more without carrying excess fat. Pediatricians use age and sex specific BMI percentiles alongside these charts to get a clearer picture.
What role do genetics play in how tall my son will be?
Genetics strongly influence a child's eventual height, so parents' heights often give a rough idea of a boy's potential. Nutrition, sleep, and overall health still shape whether he reaches that genetic potential.
Does poor sleep affect a boy's growth?
Yes, much of the body's growth hormone is released during deep sleep, so consistent rest supports healthy development. Ongoing sleep shortfalls over long periods can affect both growth and daytime energy.
How often should a boy aged 2 to 12 have his height and weight checked?
Annual well-child visits are usually enough to reveal reliable growth trends for this age group. More frequent checks are generally needed only when a doctor is monitoring a specific concern.
Insights, Analysis, and Developments
Editorial Note: Growth charts serve as guideposts rather than absolutes, reminding us that children develop along their own timelines. While these WHO, NIH, and CDC measurements offer reassurance when a child tracks within expected ranges, they also help identify when something deserves a closer look from a healthcare provider. For families raising children with disabilities or chronic conditions, having reliable baseline data becomes even more critical - not to chase some arbitrary ideal, but to catch potential complications early and ensure every child receives the nutrition and care they need to reach their own potential. These numbers tell part of the story, but the pediatrician's trained eye completes the picture. Author Credentials: Ian is the founder and Editor-in-Chief of Disabled World, a leading resource for news and information on disability issues. With a global perspective shaped by years of travel and lived experience, Ian is a committed proponent of the Social Model of Disability-a transformative framework developed by disabled activists in the 1970s that emphasizes dismantling societal barriers rather than focusing solely on individual impairments. His work reflects a deep commitment to disability rights, accessibility, and social inclusion. To learn more about Ian's background, expertise, and accomplishments, visit his full biography.