BMI Chart by Height: Normal, Overweight and Obese Ranges
Author: Ian C. Langtree - Writer/Editor for Disabled World (DW)
Published: 10 Jan 2019 - Updated: 19 Aug 2026
Publication Type: Charts, Graphs, Tables
Table of Contents:
Synopsis - Definition - Overview - FAQs - Insights, Updates - Related Content
Synopsis
The following information provides detailed BMI classification charts that allow individuals to quickly determine their weight status category based on height and weight measurements. The content proves particularly valuable for people managing chronic conditions, mobility limitations, or age-related health concerns, as it explains BMI's clinical applications while addressing its limitations for athletes and muscular individuals. The resource draws authority from National Institutes of Health guidelines and includes supplementary data on body fat percentages, the Edmonton Obesity Staging System for clinical assessment, and international obesity statistics from the Organization for Economic Co-operation and Development. Beyond simple classification, the material offers practical context about how healthcare providers use these measurements differently across populations, making it especially relevant for older adults and people with disabilities who need to understand weight-related health metrics in consultation with their medical teams.
At a Glance
- 1 - The NIH announced its standard BMI classification guidelines in June 1998.
- 2 - Japan reports the lowest obesity rate at 3.7%, while the United States ranks highest at 38.2%.
- 3 - A study projects 42% of Americans will be obese by 2030, adding an estimated $549.5 billion in medical costs.
- 4 - BMI cannot distinguish fat from muscle, so many athletes are classified as obese despite carrying little body fat.
Topic Definition
- Body Mass Index (BMI)
Body mass index is a simple screening number that compares a person's weight to their height, calculated by dividing weight in kilograms by height in meters squared. Clinicians and public health agencies rely on it because it is quick, inexpensive, and needs nothing more than a scale and a tape measure. Under the classification scale adopted by the National Institutes of Health, a BMI below 18.5 is underweight, 18.5 to 24.9 is normal, 25.0 to 29.9 is overweight, and 30.0 or above falls into one of three obesity classes. What BMI does not do is measure body fat directly, which is why a heavily muscled athlete can land in the obese range while a sedentary person of the same score carries far more fat. That gap between the number and the person behind it explains why height and weight charts work best as a starting point for a conversation with a doctor rather than as a diagnosis, and why staging tools that weigh comorbidities and functional limitations are increasingly used alongside it.
Overview
Am I Average Weight, Overweight or Obese?
Obesity is a condition characterized by the build up of excessive body fat. Obesity is defined differently depending on the country, but in Western countries, such as the U.S. and many European countries, obesity is defined as a body mass index (BMI) of 30 kg/m^2.
Weight that is higher than what is considered as a healthy weight for a given height is described as overweight or obese. Body Mass Index, or BMI, is used as a screening tool for overweight or obesity. Generally, you are not considered obese until your body weight is at least 20% above what it should be.
The most common way to determine whether or not you are of average healthy weight is by calculating your body mass index, or BMI. If your BMI is between 18 - 25 you are a normal weight. If your BMI ranges between 25 - 30 you are overweight. If your BMI is over 30 you are considered obese. Our chart below shows the data already calculated for you. Or, if you prefer, we have an Adult BMI Calculator and Chart, as well as a BMI Calculator for Children.
A Word Regarding the Accuracy of BMI
Body mass index (BMI) is the most widely used measure to diagnose obesity. However, the diagnostic accuracy of BMI to detect excess in body adiposity (obesity) is largely unknown. The main issue for using BMI is that regardless of gender and age, the same criteria is used to determine whether one is normal, overweight or obese. However, BMI should be used carefully when determining whether one is obese or not, especially when classifying different categories of people.
BMI does not really accurately tell how much fat a person really has; this is due to the nature that it cannot really differentiate between body fat and muscle mass. This is especially true when BMI were used to measure athletes, a large percentage of them were often considered to be obese, where in actual fact they are not. Many athletes tend to have high BMI due to muscle mass being built up and not due to body fat.
The United States CDC states:
"BMI does not measure body fat directly, but research has shown that BMI is moderately correlated with more direct measures of body fat obtained from skinfold thickness measurements, bioelectrical impedance, underwater weighing, dual energy x-ray absorptiometry (DXA) and other methods. Furthermore, BMI appears to be strongly correlated with various adverse health outcomes consistent with these more direct measures of body fatness."
The chart below is a rough guide that reveals if you are of average BMI and weight, overweight, or are considered to be obese for your height.
| Your Height | Normal BMI = 19 to 24 | Overweight BMI = 25 to 29 | Obese BMI = 30 to 39 |
|---|---|---|---|
| 4' 10" | 91 to 118 lbs. | 119 to 142 lbs. | 143 to 186 lbs. |
| 4' 11" | 94 to 123 lbs. | 124 to 147 lbs. | 148 to 193 lbs. |
| 5' | 97 to 127 lbs. | 128 to 152 lbs. | 153 to 199 lbs. |
| 5' 1" | 100 to 131 lbs. | 132 to 157 lbs. | 158 to 206 lbs. |
| 5' 2" | 104 to 135 lbs. | 136 to 163 lbs. | 164 to 213 lbs. |
| 5' 3" | 107 to 140 lbs. | 141 to 168 lbs. | 169 to 220 lbs. |
| 5' 4" | 110 to 144 lbs. | 145 to 173 lbs. | 174 to 227 lbs. |
| 5' 5" | 114 to 149 lbs. | 150 to 179 lbs. | 180 to 234 lbs. |
| 5' 6" | 118 to 154 lbs. | 155 to 185 lbs. | 186 to 241 lbs. |
| 5' 7" | 121 to 158 lbs. | 159 to 190 lbs. | 191 to 249 lbs. |
| 5' 8" | 125 to 163 lbs. | 164 to 196 lbs. | 197 to 256 lbs. |
| 5' 9" | 128 to 168 lbs. | 169 to 202 lbs. | 203 to 263 lbs. |
| 5' 10" | 132 to 173 lbs. | 174 to 208 lbs. | 209 to 271 lbs. |
| 5' 11" | 136 to 178 lbs. | 179 to 214 lbs. | 215 to 279 lbs. |
| 6' | 140 to 183 lbs. | 184 to 220 lbs. | 221 to 287 lbs. |
| 6' 1" | 144 to 188 lbs. | 189 to 226 lbs. | 227 to 295 lbs. |
| 6' 2" | 148 to 193 lbs. | 194 to 232 lbs. | 233 to 303 lbs. |
| 6' 3" | 152 to 199 lbs. | 200 to 239 lbs. | 240 to 311 lbs. |
| 6' 4" | 156 to 204 lbs. | 205 to 245 lbs. | 246 to 320 lbs. |
* National Institutes of Health (NIH).
Obesity Around the World
Today the United States ranks as the most obese country in the world. In the average country tracked by the OECD, about 1/5 of the population is obese.
| United States | 38.2% |
| Mexico | 32.4% |
| New Zealand | 30.7% |
| Hungary | 30% |
| Australia | 27.9% |
| United Kingdom | 26.9% |
| Canada | 25.8% |
| Chile | 25.1% |
| Finland | 24.8% |
| Germany | 23.6% |
| Ireland | 23% |
| Luxembourg | 22.6% |
| OECD Average | 22.6% |
| Czech Republic | 21% |
| Latvia | 20.6% |
| Belgium | 18.6% |
| Estonia | 18% |
| France | 17% |
| Slovak Republic | 16.9% |
| Korea | 5.3% |
| Japan | 3.7% |
| Organization for Economic Co-operation and Development - Data is for 2015 or nearest year. | |
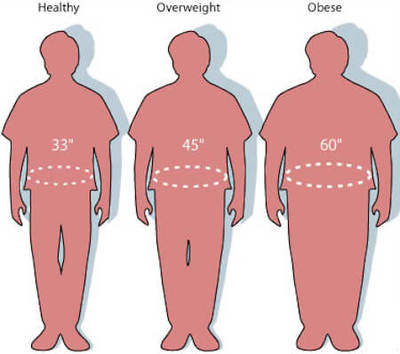
Nearly Half of Americans Will Be Obese by 2030
Many Americans are in denial about the numbers on the scale, with only half of those who are overweight or obese reporting as such. Which may help explain why a recent Gallup poll found that the obesity rates among American adults is still on the rise! If Americans keep getting heavier at the current rate, 42% of the population will be obese by 2030, a new study says. The increase accounts for an additional 32 million obese Americans and a whopping $549.5 billion in medical expenditures over the same time frame. The data did not include child obesity, so the estimates could be conservative. Obese children typically become obese adults, says America's Centers for Disease Control and Prevention's (CDC), who has proclaimed American obesity to be an "epidemic". The study is published online by the American Journal of Preventive Medicine.
Current BMI Classification Scale
In June 1998 the American National Institutes of Health (NIH) announced its BMI guidelines, to determine healthy weight, to ensure researchers, dietitians, doctors and government agencies were using the same BMI data classifications.
| BMI Number | Classified As: |
|---|---|
| Less than 18.5 | Underweight |
| 18.5 to 24.9 | Normal |
| 25.0 to 29.9 | Overweight |
| 30.0 to 34.9 | Obesity - Class I |
| 35.0 to 39.9 | Obesity - Class II |
| More than 40.0 | Extreme Obesity - Class III |
The following chart outlines the ideal body fat percentage factors in age as well as body composition difference between males and females - including the fact that body fat mass naturally increases with age.
| Age | Male Healthy Body Fat % | Female Healthy Body Fat % |
|---|---|---|
| 20 to 29 | 7 to17% | 16 to 24% |
| 30 to 39 | 12 to 21% | 17 to 25% |
| 40 to 49 | 14 to23% | 19 to28% |
| 50 to 59 | 16 to24% | 22 to31% |
| 60+ | 17 to25% | 22 to33% |
The American Council on Exercises (ACE) published a table (see below) classifying male and female fat percentage under different fitness categories. The chart is based on the percentage of essentials fats. It indicates the ideal amount of essential fats necessary for a man or woman to maintain core functions, brain development, inflammation control, blood-clotting, etc. Though the table does not include age ranges, the chart does provide ideal body fat measurement percentage specifically for athletes, fit individuals, as well as those who are average in physique, and people who are obese.
| Classification | Men Body Fat % | Women Body Fat % |
|---|---|---|
| Essential Fat | 2 to 5% | 10 to 13% |
| Athletes | 6 to 13% | 14 to 20% |
| Fitness | 14 to 17% | 21 to 24% |
| Average | 18 to 24% | 25 to 31% |
| Obese | 25% and up | 32% and up |
Proposed Clinical Staging System for Obesity
Current classifications of obesity based on body mass index, waist circumference and other anthropometric measures, although useful for population studies, have important limitations when applied to individuals in clinical practice. Thus, these measures do not provide information on presence or extent of comorbidities or functional limitations that would guide decision making in individuals.
The Edmonton obesity staging system (EOSS), is a 5-point ordinal classification system that considers comorbidity and functional status, in predicting mortality in a nationally representative US sample. The Edmonton obesity staging system independently predicted increased mortality even after adjustment for contemporary methods of classifying adiposity. The Edmonton obesity staging system may offer improved clinical utility in assessing obesity-related risk and prioritizing treatment.
| Stage 0 | Person has no obesity-related risks (normal blood pressure, glucose levels) or symptoms, psychopathy or limitations. |
|---|---|
| Stage 1 | Subclinical risk factors related to obesity are present. A person may have borderline hypertension. There may be mild physical symptoms (aches/pains), psychopathy and limitations. |
| Stage 2 | The person has obesity-related chronic diseases and moderate symptoms and limitations. |
| Stage 3 | The person has damaged organs and experiences significant limitations. |
| Stage 4 | The person has severe disabilities as a result of obesity-related chronic disease(s). |
Helpful Related Charts, Tables and Reference Guides:
Generally, obesity is treated with certain lifestyle changes such as diet plans and making exercise routines. Medications and surgeries may also be an option depending on the cause of the obesity, its severity, and the individual's choices. If you have been diagnosed with obesity, contact your doctor to discuss the most current treatment options.
Frequently Asked Questions
How do you calculate BMI without a calculator
Divide your weight in kilograms by your height in meters squared, or in imperial units multiply your weight in pounds by 703, then divide that result by your height in inches squared.
Is BMI measured the same way for children and teens
No. For anyone aged 2 to 19 the BMI value is plotted on age and sex specific growth percentile charts, so a child is classed as overweight at or above the 85th percentile and obese at or above the 95th percentile.
What waist measurement is considered high risk
Health agencies generally flag a waist circumference above 40 inches in men and above 35 inches in non pregnant women as a marker of increased risk for type 2 diabetes, high blood pressure and heart disease.
Do BMI thresholds differ for people of Asian descent
Yes. Because health risks appear at lower body weights in many Asian populations, the World Health Organization suggests lower action points, with overweight often set near a BMI of 23 and obesity near 27.5.
How can BMI be estimated for a wheelchair user who cannot stand
Clinicians commonly substitute a proxy measurement such as arm span, demi span, knee height or ulna length to estimate standing height, then apply that figure to the standard BMI formula.
Is BMI useful during pregnancy
Standard BMI categories are not applied during pregnancy. Providers instead record pre pregnancy BMI and use it to set recommended ranges for total gestational weight gain.
How much weight loss is needed to see health benefits
Research on adults with excess weight shows that losing 5 to 10 percent of starting body weight can meaningfully improve blood pressure, blood sugar and cholesterol, even if BMI stays in the overweight or obese range.
What alternatives to BMI give a better picture of body fat
Options include waist to height ratio, waist to hip ratio, skinfold caliper testing, bioelectrical impedance, hydrostatic weighing and DXA scanning, with DXA and hydrostatic weighing regarded as the most precise.
Insights, Analysis, and Developments
Editorial Note: While BMI remains the most practical screening tool for weight classification in clinical and population health settings, it's worth remembering that numbers alone don't tell the full story of human health. The Edmonton Obesity Staging System represents a more nuanced approach - one that acknowledges what physicians have long understood: that two people with identical BMIs can have vastly different health profiles and needs. As we continue grappling with rising obesity rates globally, particularly the projected trajectory in the United States, the challenge isn't just about calculating body mass or setting numerical thresholds. It's about using these metrics as starting points for meaningful conversations between patients and healthcare providers, conversations that account for individual circumstances, functional limitations, and quality of life. The scales and charts matter, certainly, but they work best when combined with clinical judgment and an understanding that health exists along a continuum far more complex than any single measurement can capture.
 Author Credentials: Ian is the founder and Editor-in-Chief of Disabled World, a leading resource for news and information on disability issues. With a global perspective shaped by years of travel and lived experience, Ian is a committed proponent of the Social Model of Disability, a transformative framework developed by disabled activists in the 1970s that emphasizes dismantling societal barriers rather than focusing solely on individual impairments. His work reflects a deep commitment to disability rights, accessibility, and social inclusion. To learn more about Ian's background, expertise, and accomplishments, visit his full biography.