Teen Girls Height Weight Chart Ages 13-20 Years Reference
Author: Ian C. Langtree - View Credentials
Published: 21 Aug 2023 - Updated: 19 Sep 2026
Publication Type: Charts, Graphs, Tables
Table of Contents:
Synopsis - Definition - Overview - FAQs - Insights, Updates - Related Content
Synopsis
This chart provides reference data on average height-to-weight ratios for teenage girls between 13 and 20 years of age, sourced from reputable medical organizations including the World Health Organization, the National Institutes of Health's Gerontology Research Center, and the U.S. Centers for Disease Control and Prevention. The information proves particularly valuable for parents, healthcare providers, and teenagers tracking physical development during puberty, which typically begins around ages 10-11 and concludes by 15-17 for girls. Beyond general use, this resource serves families managing disabilities or health conditions that may affect growth patterns, offering a baseline for comparison without promoting unhealthy dieting practices. The availability of both metric and imperial measurements, along with printable formats, makes the data accessible for diverse users regardless of measurement system preference or visual presentation needs.
At a Glance
- 1 - Most girls add roughly one to three more inches after their first period, though the amount varies with how early it started. Girls who begin menstruating earlier tend to have more remaining growth.
- 2 - Adolescent girls generally need around 1300 milligrams of calcium daily to build peak bone mass, plus adequate vitamin D for absorption. Iron needs rise after periods begin, commonly to around 15 milligrams a day.
- 3 - Warning signs of an eating disorder include missed periods, sudden weight loss, avoiding meals with others, and intense preoccupation with food or exercise. Early evaluation matters because these conditions affect bone density and long-term health.
- 4 - The table shows the 50th percentile of the CDC 2000 charts, built from survey data gathered before that year. Measured averages in the United States have risen since then, particularly at the older ages.
Topic Definition
- Teen Girls Height Weight Chart
A teen girls height weight chart is a reference table that sets out the average height and weight expected for adolescent females at each age, here spanning 13 through 20 years. Rather than acting as a target every teenager must meet, it gathers averages from large population studies so parents, teens, and healthcare providers can see roughly where an individual sits alongside her peers. This stretch covers the tail end of puberty, when weight, height, bone composition, and body fat distribution can shift dramatically before settling around the late teens. Because genetics, ethnicity, nutrition, and activity all shape how a girl develops, the chart works best as a general guide for tracking steady, healthy progress over time - and as a starting point for a conversation with a doctor who can read the numbers against a teen's full health picture rather than a prompt for dieting or comparison.
Overview
Understanding Physical Changes in Girls During the Teenage Years
Both genetic and environmental factors influence your height and weight. A teen girls average height and weight will vary by age, race, ethnicity, and nationality. Throughout childhood, a young girls body begins to become more proportional as they approach puberty. On average, girls commence puberty around ages 10 to 11 and end puberty around 15 to 17 years of age. During this time adolescent girls typically experience dramatic changes in weight, bone composition, height, and body fat distribution.
NOTE: If you are older than 20 you will need to refer to our Adults Height to Weight Chart.
| Age | Weight | Height |
|---|---|---|
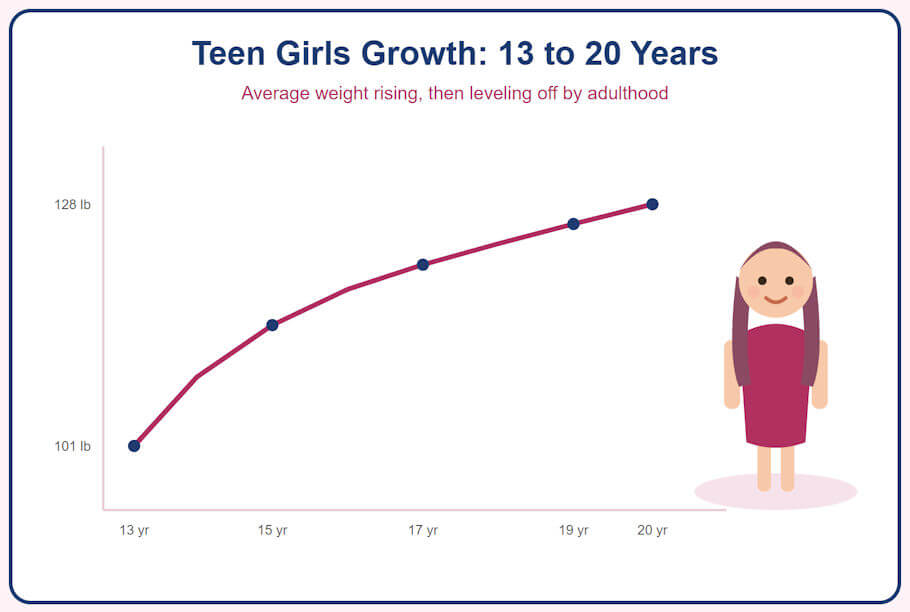
| 13 Years | 101.4 lb. (45.99 kg) | 61.9" (157.2 cm) |
| 14 Years | 109.1 lb. (49.49 kg) | 63.2" (160.5 cm) |
| 15 Years | 114.9 lb. (52.12 kg) | 63.7" (161.8 cm) |
| 16 Years | 118.9 lb. (53.93 kg) | 64.0" (162.6 cm) |
| 17 Years | 121.7 lb. (55.20 kg) | 64.1" (162.8 cm) |
| 18 Years | 124.0 lb. (56.25 kg) | 64.2" (163.1 cm) |
| 19 Years | 126.4 lb. (57.33 kg) | 64.3" (163.3 cm) |
| 20 Years | 128.4 lb. (58.24 kg) | 64.3" (163.3 cm) |
Note: The teenage figures are reference medians (the 50th percentile of the CDC growth charts), not measured averages of young people today. Actual measured averages in the United States run higher, particularly at the older ages, so the 20-year row should be read as the middle of the reference distribution rather than as the typical weight or height of a 20-year-old.
Every teenage female is different in how they mature and grow during their teen years. Dieting for teen girls is not recommended, as quite often you will find you will simply "grow out" of your "baby fat" and stabilize around 18-20 years of age as you mature into a young adult.
Frequently Asked Questions
Why do these reference medians differ from the measured average weight of young women today?
The table shows the 50th percentile of the CDC 2000 growth charts, which were built from survey data gathered before that year. Measured averages in the United States have risen since then, particularly at the older ages, so the reference median describes the middle of a standard distribution rather than a current population average.
How is BMI interpreted for a teenage girl?
Teen BMI is read against age and sex specific percentiles rather than the fixed adult cutoffs, because normal body composition changes throughout adolescence. It is a screening measure only, and it can misclassify athletic girls with high muscle mass or those with an unusual body frame.
What is a healthy pace for a teen girl to reach her adult height?
Growth typically slows to under an inch a year in the two or three years following the first period, then stops when the growth plates close. A doctor may order a bone age x-ray if growth stalls unexpectedly early or continues unusually late.
Can a girl still grow taller after her first period?
Yes, most girls add roughly one to three more inches after menarche, though the amount varies with how early the period started. Girls who begin menstruating earlier tend to have more remaining growth than those who start later.
What warning signs suggest a teen girl may have an eating disorder?
Missed periods, sudden weight loss or stalled growth, avoiding meals with others, intense preoccupation with food or exercise, and withdrawal from friends are common signals. Early evaluation matters because these conditions affect bone density and long term health, and treatment works better the sooner it begins.
How much calcium and iron does a teenage girl need?
Adolescent girls generally need around 1300 milligrams of calcium daily to build peak bone mass, plus adequate vitamin D for absorption. Iron needs rise after periods begin, commonly to around 15 milligrams a day, and a doctor can test for deficiency if fatigue or heavy bleeding is a concern.
How do growth charts apply to teen girls with disabilities or chronic conditions?
Standard charts still provide a baseline, but limited mobility, altered muscle mass, feeding difficulties, or hormonal conditions can move measurements away from the median. Where standing height cannot be measured, clinicians use arm span or knee height, and some conditions have their own specialized growth references.
Does birth control or other medication affect a teen girl weight or growth?
Some hormonal contraceptives are associated with modest weight changes in a minority of users, while long term oral steroids can slow growth. Any noticeable change after starting a new medication is worth reviewing with the prescribing clinician rather than stopping treatment independently.
How These Figures Were Derived and Last Verified
Every number in the table above is the median (50th percentile) of a published growth reference, not an average of site visitors or an in-house estimate. The figures come from the CDC 2000 clinical growth charts, taken from the published weight-for-age and stature-for-age percentile data files. In each row the imperial and metric values are converted from the source figure in its original unit and rounded consistently, so the two unit systems agree with one another. The complete set of figures was last checked cell by cell against the source data files on 26 July 2026, and matches our full height-to-weight guide for infants through teens.
Source References
- 1 - U.S. Centers for Disease Control and Prevention: Growth Charts - main resource page.
- 2 - U.S. Centers for Disease Control and Prevention: Percentile Data Files with LMS Values - the weight-for-age and stature-for-age files used for ages 2 to 20 years.
Other Printable Height to Weight Reference Charts:
Insights, Analysis, and Developments
Editorial Note: While these averages offer a useful snapshot of typical adolescent development, they represent just one piece of a much larger picture of teenage health. Growth during the teen years follows no single path - genetics, ethnicity, nutrition, activity level, and underlying health conditions all shape how an individual develops. Rather than fixating on matching these numbers exactly, families and healthcare providers should view them as general guidelines that help identify when growth patterns might warrant further evaluation. The real value lies not in the destination these numbers suggest, but in tracking the journey of consistent, healthy development over time, recognizing that every teenager matures at their own pace and in their own way.
 Author Credentials: Ian C. Langtree is a writer, editor, and the founder and Editor-in-Chief of Disabled World, which he established in 2004 as one of the longest-running independent resources for disability news and information. Over more than two decades, he has written and edited thousands of articles on disability rights, health, accessibility, and assistive technology. Drawing on a global perspective shaped by extensive travel and lived experience, Ian is a committed advocate of the Social Model of Disability, the framework developed by disabled activists in the 1970s that focuses on removing societal barriers rather than on individual impairments. His writing is grounded in that framework and in a lasting commitment to disability rights, accessibility, and social inclusion. To learn more about Ian's background, expertise, and accomplishments, visit his full biography.