Teen Boys Height Weight Chart Ages 13-20
Author: Ian C. Langtree - View Credentials
Published: 21 Aug 2023 - Updated: 19 Sep 2026
Publication Type: Conversion, Calculation
Table of Contents:
Synopsis - Definition - Overview - FAQs - Insights, Updates - Related Content
Synopsis
This reference chart presents average height and weight measurements for male adolescents aged 13 through 20 years, drawing data from trusted health organizations including the World Health Organization, the National Institutes of Health's Gerontology Research Center, and the U.S. Centers for Disease Control and Prevention. The tool serves as a practical guide for parents, healthcare providers, and teenagers tracking typical growth patterns during puberty and adolescence, when boys experience rapid physical development between ages 11 and 17. By providing both metric and imperial measurements in an accessible table format, the chart helps families and medical professionals identify general growth trends while recognizing that individual variations in body type, muscle mass, and maturation rates are entirely normal. This resource proves particularly valuable for families managing developmental concerns, growth-related medical conditions, or those simply seeking reassurance about whether a teen's physical development falls within expected parameters.
At a Glance
- 1 - Measuring every three to six months is usually enough to see a clear trend without focusing on small day-to-day changes. The direction of growth over time is far more informative than any single measurement.
- 2 - By the time a teen boy reaches 18, his height has typically about doubled compared to when he was 2 years old. Boys often simply grow out of baby fat, so dieting is not recommended.
- 3 - Delayed puberty is worth discussing with a doctor if there are no signs by about age 14, if growth stops for a year or more, or if a boy crosses downward through percentile lines. Most cases are a constitutional delay that resolves on its own.
- 4 - A median is the middle value where half of boys fall above and half below, while an average is the arithmetic mean of all values. Charts use medians because a few very tall or heavy individuals can pull an average upward.
Topic Definition
- Teen Boys Height Weight Chart
A teen boys height weight chart is a reference table that sets out the average height and weight expected for male adolescents at each age, here covering 13 through 20 years. Rather than laying down a target every teenager must reach, it draws averages from large population studies so parents, teens, and healthcare providers can see roughly where an individual sits next to his peers. These years capture the heart of male puberty, which usually runs from about 11 to 17 and brings growth spurts faster than at any other point in life, along with rapid swings in weight, height, and internal development. Since body type, muscle mass, and maturation rates vary widely from one boy to the next, the chart works best as a general guide for tracking steady, healthy growth over time - and as a starting point for a conversation with a doctor who can weigh the numbers against a teen's complete health picture rather than a reason to diet or worry.
Overview
What to Expect as Boys Grow Through the Teenage Years
The weight-to-height ratio measurement in teenage males serves as just a single factor in assessing whether their weight aligns with a healthy average for their height. However, this measurement does not consider individual variations in body types and muscle mass. Its primary function is to provide a recommended range of body weight that is considered ideal for male teenagers.
As boys generally start puberty around age 11 to 12 and end around 16 to 17, teenage boys will often have growth spurts during their growing years in which your body will grow faster than at any other time in your life. During this period, it is possible to gain and lose weight rapidly and add inches to your height - seemingly overnight. Growth not only involves the length and weight of your body, but also includes internal growth and development.
NOTE: If you are older than 20 you will need to refer to our Adults Height to Weight Chart.
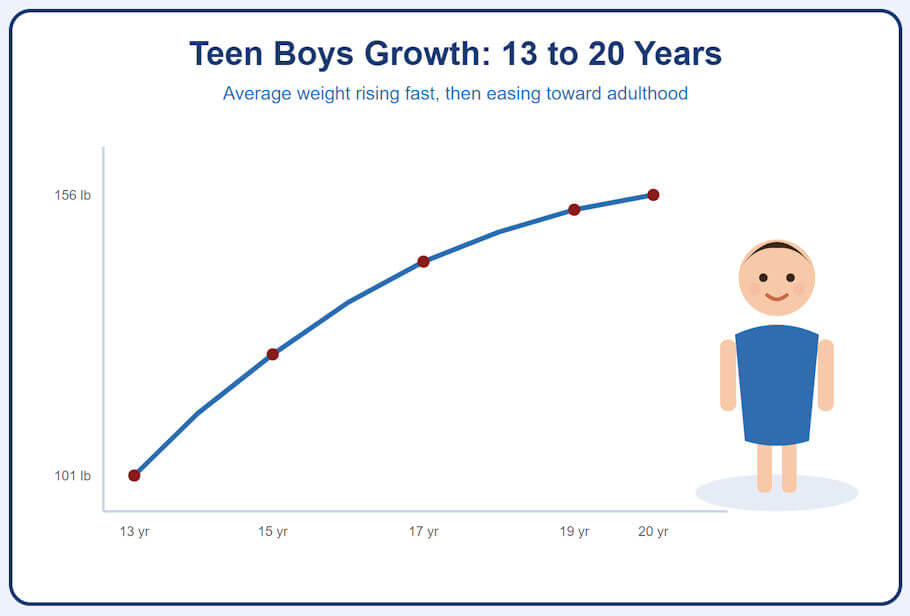
| Age | Weight | Height |
|---|---|---|
| 13 Years | 101.0 lb. (45.81 kg) | 61.6" (156.5 cm) |
| 14 Years | 112.9 lb. (51.21 kg) | 64.6" (164.1 cm) |
| 15 Years | 124.5 lb. (56.47 kg) | 67.0" (170.2 cm) |
| 16 Years | 134.7 lb. (61.10 kg) | 68.4" (173.7 cm) |
| 17 Years | 142.6 lb. (64.68 kg) | 69.0" (175.3 cm) |
| 18 Years | 148.3 lb. (67.27 kg) | 69.4" (176.3 cm) |
| 19 Years | 152.5 lb. (69.17 kg) | 69.5" (176.5 cm) |
| 20 Years | 155.6 lb. (70.58 kg) | 69.6" (176.8 cm) |
Note: The teenage figures are reference medians (the 50th percentile of the CDC growth charts), not measured averages of young people today. Actual measured averages in the United States run higher, particularly at the older ages, so the 20-year row should be read as the middle of the reference distribution rather than as the typical weight or height of a 20-year-old.
Every teenage male is different in how they mature and grow during their teen years. Dieting for male teenagers is not recommended, as quite often you will find boys will simply "grow out" of their "baby fat" as they mature into young adults. Typically, by the time they reach 18 years of age, the height of a teen boy has approximately doubled compared to when they were 2 years old.
Frequently Asked Questions
What is the difference between a median and an average on a teen growth chart?
A median is the middle value of a reference population, meaning half of boys fall above it and half below it, while an average is the arithmetic mean of all measured values. Growth charts use medians because a small number of very tall or very heavy individuals can pull an average upward and misrepresent the typical teen.
How often should a teen boy be measured for height and weight?
Measuring every three to six months is usually enough to see a clear trend without focusing on small day-to-day changes. Tracking the direction of growth over time is far more informative than any single measurement compared against a chart row.
Does time of day affect how tall a teen boy measures?
Yes, most people measure slightly taller in the morning because spinal discs compress under body weight through the day. To keep readings consistent, measure at the same time of day, without shoes, with heels together and back against a flat wall.
Is BMI a reliable measure for teenage boys?
BMI for teens is interpreted using age and sex specific percentiles rather than the fixed adult categories, so the same number means different things at different ages. It can also overstate body fat in muscular athletes and understate it in boys with low muscle mass, so it works best as a screening tool rather than a diagnosis.
Can poor sleep or nutrition slow a teen boy down growth?
Much of the growth hormone released during adolescence is secreted during deep sleep, so chronically short sleep can affect growth and recovery. Inadequate calories, protein, calcium, vitamin D, or iron can also slow the pace of growth, though most teens catch up once nutrition and sleep improve.
Do these charts apply to teen boys outside the United States?
The figures come from United States reference data, so they suit populations with similar growth patterns but may not match every country. The World Health Organization growth references are often preferred internationally, and clinicians in some regions use national charts built from local measurements.
How do growth charts apply to teens with disabilities or chronic conditions?
Standard charts still provide a useful baseline, but conditions affecting mobility, muscle tone, nutrition, or hormone levels can shift measurements away from the reference median. Some conditions have specialized growth charts, and a clinician can advise which reference is most appropriate for an individual teen.
When should delayed puberty in a teen boy be discussed with a doctor?
A conversation is reasonable if there are no signs of puberty by about age 14, if growth appears to stop for a year or more, or if a boy crosses downward through percentile lines he previously followed. Most cases turn out to be a constitutional delay that resolves on its own, but testing can rule out hormonal, nutritional, or chronic health causes.
How These Figures Were Derived and Last Verified
Every number in the table above is the median (50th percentile) of a published growth reference, not an average of site visitors or an in-house estimate. The figures come from the CDC 2000 clinical growth charts, taken from the published weight-for-age and stature-for-age percentile data files. In each row the imperial and metric values are converted from the source figure in its original unit and rounded consistently, so the two unit systems agree with one another. The complete set of figures was last checked cell by cell against the source data files on 26 July 2026, and matches our full height-to-weight guide for infants through teens.
Source References
- 1 - U.S. Centers for Disease Control and Prevention: Growth Charts - main resource page.
- 2 - U.S. Centers for Disease Control and Prevention: Percentile Data Files with LMS Values - the weight-for-age and stature-for-age files used for ages 2 to 20 years.
Other Printable Height to Weight Reference Charts:
Insights, Analysis, and Developments
Editorial Note: Growth during the teenage years remains one of the most variable aspects of human development, with some boys shooting up several inches in mere months while others mature at a steadier pace. What this chart reinforces is that there's no single "correct" trajectory for adolescent development - the ranges provided reflect population averages, not prescriptive targets. Parents and teens who notice significant deviations from these measurements shouldn't jump to conclusions but rather view them as potential conversation starters with healthcare providers who can assess individual health holistically. The real value of this data lies not in creating anxiety about numbers on a scale, but in helping families understand that dramatic physical changes during adolescence are expected, temporary, and part of the natural process of becoming an adult. After all, the teen who feels too short at 15 may well find himself eye-to-eye with his father by 17.
 Author Credentials: Ian C. Langtree is a writer, editor, and the founder and Editor-in-Chief of Disabled World, which he established in 2004 as one of the longest-running independent resources for disability news and information. Over more than two decades, he has written and edited thousands of articles on disability rights, health, accessibility, and assistive technology. Drawing on a global perspective shaped by extensive travel and lived experience, Ian is a committed advocate of the Social Model of Disability, the framework developed by disabled activists in the 1970s that focuses on removing societal barriers rather than on individual impairments. His writing is grounded in that framework and in a lasting commitment to disability rights, accessibility, and social inclusion. To learn more about Ian's background, expertise, and accomplishments, visit his full biography.