Understanding Paraplegia and Quadriplegia: Key Facts
Author: Ian C. Langtree - Writer/Editor for Disabled World (DW)
Published: 17 May 2013 - Updated: 5 Jan 2026
Publication Type: Informative
Table of Contents:
Synopsis - Overview - Insights, Updates - Related Content
Synopsis
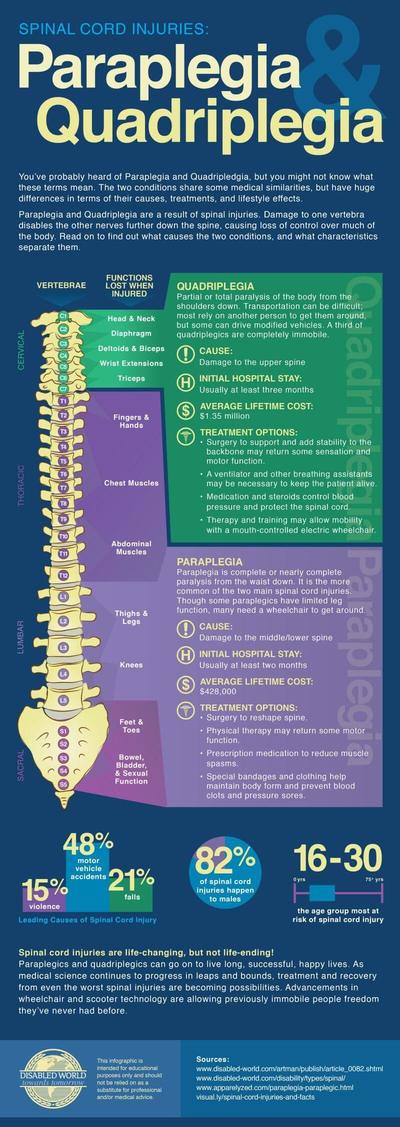
This information provides a detailed breakdown of the medical definitions, statistical realities, and socioeconomic impacts of paraplegia and quadriplegia resulting from spinal cord injuries. The resource draws on established medical data to clarify the distinction between these two conditions - paraplegia affecting the lower body from the waist down, and quadriplegia affecting both arms and legs from the shoulders down. It offers practical value to patients, caregivers, and healthcare professionals by presenting hard numbers on injury rates, causes, recovery outcomes, and lifetime costs, making it particularly useful for those navigating the healthcare system after a spinal cord injury. The demographic breakdowns by age, gender, race, and employment status help readers understand the scope of these injuries across different populations, while the financial data provides realistic expectations for long-term planning and resource allocation.
Overview
SCI Facts:
Paraplegia - Paralysis from the waist down.
Quadriplegia - Paralysis from the shoulders down.
Complete Injuries - Result in the total loss of sensation and function below he injury level.
Incomplete Injuries - Result in partial loss of sensation and function below the injury level.
- There are 32 injuries per million population or 7800 injuries in the US yearly.
- An estimated additional 20 cases per million (4860 per year) die before reaching the hospital.
- 89.3% of all persons with spinal cord injury (SCI) who are discharged from the system are sent to private, non-institutional residence.
- 6.6% are discharged to nursing home.
- The rest are discharged to hospitals, group living situations and other destinations.
- Only 0.9% of Spinal Cord Injuries (SCI) fully recover.
- Average yearly expense for spinal cord injuries can range from $228,566 to $775,576 in the first year.
- Estimated lifetime costs due to spinal cord injury can range from $681,843 to over $3 million for a 25 year old.
- Only 52% of SCI individuals are covered by private health insurance at the time of injury.
Causes of Paraplegia and Quadriplegia
- 48% motor vehicles
- 21% falls
- 15% violence
- 14% sports (66% which are diving related)
- 2% others
Race and Ethnicity
- 66% of those injured are Caucasian
- 26.2% are African American
- 2.1% are Asian
- 0.9% are Native American
Age and Gender Statistics
- 82% of those injured are male
- 18% are female
- Highest per capita rate of injuries occurs between the ages of 16-30
- Average age at injury is 33.4
- Median age at injury 26
- Mode age at injury 19
- Falls overtake leading cause after the age of 45
Marital Status at Injury
- 53% single
- 31% married
- 9% divorced
- 7% other
Employment Status
- 58.8% employed
- 41.2% unemployed (includes students, retirees and homemakers)
- After 8 years 34.4% of paraplegics and 24.3% of quadriplegics were still employed
Insights, Analysis, and Developments
Editorial Note: The statistics presented here tell a sobering story about spinal cord injuries in America, but they also reveal patterns that point toward prevention and better outcomes. The fact that motor vehicle accidents and falls account for nearly 70 percent of all cases suggests that many of these life-altering injuries are preventable through improved safety measures and public awareness campaigns. Perhaps most striking is the employment data - while more than half of people with paraplegia maintain employment eight years post-injury, the rate drops significantly for those with quadriplegia, highlighting the ongoing need for workplace accommodations and assistive technologies that can bridge this gap. The recovery rate of less than one percent underscores why prevention remains paramount, but the 89 percent of individuals living independently in private residences demonstrates that with proper support systems, most people with spinal cord injuries can maintain autonomy and quality of life outside institutional settings.
 Author Credentials: Ian is the founder and Editor-in-Chief of Disabled World, a leading resource for news and information on disability issues. With a global perspective shaped by years of travel and lived experience, Ian is a committed proponent of the Social Model of Disability-a transformative framework developed by disabled activists in the 1970s that emphasizes dismantling societal barriers rather than focusing solely on individual impairments. His work reflects a deep commitment to disability rights, accessibility, and social inclusion. To learn more about Ian's background, expertise, and accomplishments, visit his full biography.