Health and Disability Infographics: Facts and Figures
Author: Disabled World (DW)
Updated/Revised Date: 27 Jul 2026
Table of Contents:
Synopsis - Definition - About This Section - FAQs - Publications - Subtopics
Synopsis
A collection of health and disability infographics presenting disability facts, statistics, and current social issues in a clear, easy-to-read visual format.
At a Glance
- 1 - You can submit your own disability-related infographic to be added to the list.
- 2 - One featured infographic on disability statistics in America is courtesy of Braunability.
- 3 - Infographics improve cognition by using graphics to help the visual system spot patterns and trends.
- 4 - Creating infographics is also known as data visualization, information design, or information architecture.
Topic Definition
- Infographic
An infographic is a graphic, visual representation of information, data, or knowledge that is designed to communicate complex ideas quickly and clearly. By pairing figures and facts with charts, icons, and illustrations, it takes advantage of the human visual system's natural ability to recognize patterns and trends, making dense material easier to absorb at a glance than plain text alone. In the context of disability, infographics are often used to present statistics, research findings, and everyday realities in a form that both informs and prompts reflection. The work of planning and building them is commonly described as data visualization, information design, or information architecture, and a well-made example balances accuracy with a layout that is genuinely easy to follow.
Overview
The Disabled World collection of interesting infographics focuses on various disabilities, as well as disability facts and current issues in today's society.
What is an Infographic?
Wikipedia defines an infographic as:
"Graphic visual representations of information, data, or knowledge intended to present complex information quickly and clearly. They can improve cognition by utilizing graphics to enhance the human visual system's ability to see patterns and trends. The process of creating infographics can be referred to as data visualization, information design, or information architecture."
Our infographic list below will help you learn some facts and figures about disability around the world, and reflect upon some experiences of people with disabilities.
If you have an infographic relating to disability and would like to add it to our list, please contact us.
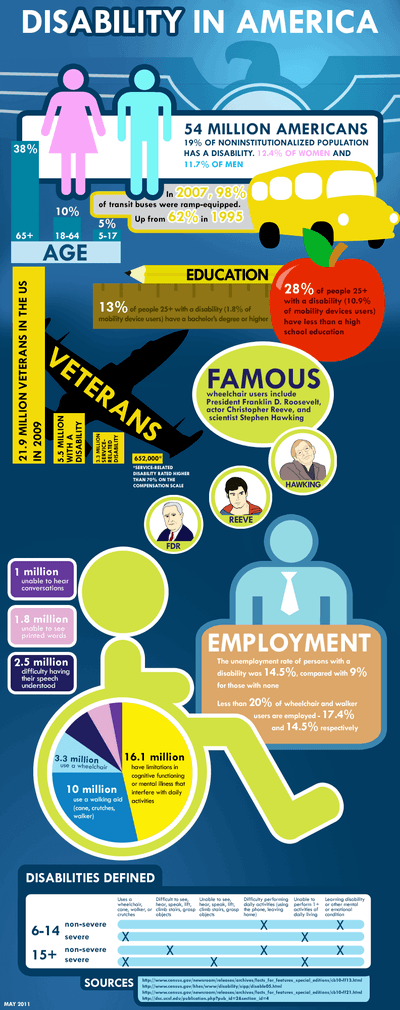
* Infographic of Some Disability Statistics in America courtesy of Braunability
Frequently Asked Questions
What makes a good disability infographic?
A strong infographic pairs accurate, clearly sourced data with a clean layout that guides the eye from one point to the next. It focuses on a single main message, uses readable fonts and sensible color contrast, and avoids clutter so the key facts stand out. Citing the data source and date also helps readers trust what they are seeing.
How can I make an infographic accessible to people with disabilities?
Provide descriptive alternative text and a text summary so screen reader users can access the same information conveyed by the graphic. Use high color contrast, avoid relying on color alone to signal meaning, and offer the underlying data in an accessible format such as an HTML table. Testing with accessibility tools helps confirm the design works for everyone.
Can I reuse or share the infographics on this page?
Reuse depends on each infographic's copyright and any credit line attached to it, since many are created by outside organizations. Always check for a stated license or attribution requirement, and when in doubt, contact the original creator for permission. Crediting the source is good practice even when sharing is allowed.
What tools are commonly used to create infographics?
People often use design platforms such as Canva, Piktochart, or Adobe Illustrator, along with spreadsheet and charting tools for the underlying data. The best choice depends on your skill level, budget, and whether you need simple templates or full custom design. Free tools can work well for straightforward charts and layouts.
Where should the data in a disability infographic come from?
Reliable figures typically come from government agencies, academic research, and recognized health or disability organizations. Using primary sources and noting the year the data was collected helps keep an infographic credible and current. Combining multiple reputable sources can give a fuller picture when a single dataset is limited.
Why are infographics effective for sharing disability statistics?
Statistics can feel abstract, but visuals turn numbers into patterns people can grasp in seconds, which improves recall and engagement. This makes infographics useful for awareness campaigns, education, and social media, where attention is short. They can also spark reflection by pairing figures with real-world context.
How do I submit my own disability infographic for the list?
You can request to have an infographic added by contacting the site through its listed contact method. Providing details such as the topic, data sources, and any credit or licensing information helps with review. Clear, well-sourced graphics that fit the disability focus have the best chance of being included.
Curated and edited by Ian C. Langtree, Founder & Editor-in-Chief, Disabled World. This section is maintained by the Disabled World editorial team. Last updated: