Old and New Food Pyramid Guide with Serving Charts
Author: Ian C. Langtree - Writer/Editor for Disabled World (DW)
Published: 20 Dec 2017 - Updated: 18 Aug 2026
Publication Type: Informative
Table of Contents:
Synopsis - Definition - Overview - FAQs - Insights, Updates - Related Content
Synopsis
This information provides a practical comparison of the original USDA Food Pyramid and its 2005 revision, offering detailed serving size guidelines and visual references that help people understand balanced nutrition. The guide breaks down the six food groups with specific portion recommendations tailored to different demographics - from children and seniors to teenagers - making it particularly valuable for individuals who need clear, actionable dietary information. People managing health conditions, older adults monitoring their nutrition, and those with mobility limitations who want to optimize their diet without complex calculations will find the straightforward serving charts and MyPlate framework especially useful. The content draws from official USDA nutritional standards, presenting evidence-based recommendations in an accessible format that translates government dietary guidelines into everyday meal planning.
At a Glance
- 1 - The USDA revised the food pyramid in spring 2005 to reflect current dietary science.
- 2 - Bread, cereal, rice, and pasta form the pyramid base at 6 to 11 daily servings.
- 3 - MyPlate divides a plate into roughly 30 percent grains, 30 percent vegetables, 20 percent fruits, and 20 percent protein, with a side of dairy.
- 4 - The new pyramid adds a stair-climbing figure to stress 30 minutes of daily activity for adults and 60 minutes for children.
Topic Definition
- Food Pyramid
The food pyramid is a graphical nutrition guide, first issued by the U.S. Department of Agriculture, that arranges the major food groups by the proportion a person should eat each day. Foods you should eat most, such as breads, grains, and cereals, sit at the wide base, while fats, oils, and sweets to be used sparingly sit at the narrow top. The original design grouped six categories into horizontal bands with recommended serving ranges, and the 2005 update reworked it into vertical color bands to show that no single set of numbers fits everyone, since needs shift with age, activity level, and weight goals. It later gave way to MyPlate, a plate-shaped model, but the pyramid remains a widely recognized starting point for building a balanced diet.
Overview
The Food Guide Pyramid is a graphical representation allowing people to better understand how to eat healthy. A balanced diet is one that includes all the food groups of the food pyramid. The U.S. Department of Agriculture (USDA) changed the food pyramid in spring 2005 because they wanted to convey a better example of how to eat healthier. The new pyramid is based on the best available scientific facts concerning links between diet and good health.
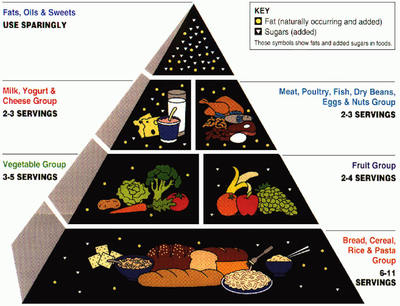
This new food pyramid addresses flaws in the original USDA food pyramid and offers better up to date information allowing people to better follow guidelines concerning what they should eat. Below is a picture of both the old and new food pyramids.
Picture of the Old Food Pyramid
You should center your diet around the foods at the base of the food pyramid, and eat less of the foods at the top. If you're watching your weight then you should concentrate on eating the minimum number of recommended daily servings. If you are looking to gain extra weight, eat the maximum number of servings.
Picture of the New Food Pyramid
The New Food Pyramid is a tool to educate people to eat a more balanced diet from a greater variety of food portions without counting calories. The USDA has now expanded the four food groups to six groups and expanded the number of servings to meet the calorie needs of most people.
The new food pyramid is more flexible and accurate than the one we had a few years ago. The reason being that one image of a pyramid with markings of what your daily intake should be can not apply to everyone. It all depends on a person's lifestyle and how much exercise they get involved in during a week. It also depends on if a person is trying to lose weight or gain weight. If a person is trying to gain weight then they should proceed to having the highest amounts of recommended servings, if a person is trying to lose weight then they should try to aim for the lowest recommended servings per day.

My Plate
My Plate is the current nutrition guide published by the United States Department of Agriculture, depicting a place setting with a plate and glass divided into five food groups. It replaced the USDA's MyPyramid guide.
MyPlate is divided into sections of approximately 30 percent grains, 30 percent vegetables, 20 percent fruits and 20 percent protein, accompanied by a smaller circle representing dairy, such as a glass of low-fat/nonfat milk or a yogurt cup.

| How many servings of each per day should you eat? | |||
|---|---|---|---|
| Foods | Women, Children, Elderly | Teen Girls | Teen Boys |
| Calorie level | Approx. 1,600 | Approx. 2,200 | Approx. 2,800 |
| MILK Group Products | 2 to 4 | 2 to 4 | 2 to 4 |
| MEAT Group | 2 | 2 | 3 |
| VEGETABLE Group | 3 | 4 | 5 |
| FRUIT Group | 2 | 3 | 4 |
| BREAD and Cereals | 6 | 9 | 11 |
| Total Fat in Grams | 36 - 53 | 49 - 73 | 62 -q 93 |
How Much Does One Serving Equal?
Milk products group:
- 1 cup about 8 oz. of milk or yogurt
- 2 slices of cheese, 1/8" thick (1 1/2 oz.)
- 2 cups of cottage cheese
- 1 1/2 cups of ice milk, ice cream or frozen yogurt
Meat group:
- 2 oz. to 3 oz. of cooked lean meat, poultry, fish
- 2 eggs
- 7 oz. tofu
- 1 cup cooked legumes or dried beans or peas
- 4 tablespoons peanut butter
- 1/2 cup nuts or seeds
Vegetables:
- 1/2 cup cooked vegetables
- 1/2 cup raw chopped vegetables
- 1 cup raw leafy vegetables
- 1/2 to 3/4 cup vegetable juice
Fruits:
- 1 whole medium fruit (about 1 cup)
- 1/4 cup dried fruit
- 1/2 cup canned fruit
- 1/2 to 3/4 cup fruit juice
Bread and Cereals:
- 1 slice bread
- 1 medium muffin
- 1/2 hot dog bun or hamburger bun
- 1/2 bagel or English muffin
- 4 small crackers
- 1 tortilla
- 1 cup cold cereal
- 1/2 cup cooked cereal
- 1/2 cup rice
- 1/2 cup pasta.
Frequently Asked Questions
Who created the food pyramid
The food pyramid was created and published by the United States Department of Agriculture, known as the USDA, as a national nutrition guide.
When was the original food pyramid released
The original USDA food pyramid was introduced in 1992 and remained the main guide until the 2005 revision expanded and updated it.
What replaced the food pyramid
MyPlate replaced the pyramid models in 2011 and is the current USDA nutrition guide, shown as a place setting with a plate and glass.
How many food groups are in the new pyramid
The new food pyramid expanded the earlier four food groups into six groups covering grains, vegetables, fruits, oils, dairy, and meat and beans.
Why did the USDA change the food pyramid
The USDA changed it to reflect newer scientific evidence and to show that daily servings depend on a person lifestyle, activity, and weight goals.
Is the food pyramid still used today
The pyramid is no longer the official guide but is still widely taught and referenced as a simple visual for understanding balanced eating.
How much water should be included in a healthy diet
The pyramid does not set water servings, but general guidance suggests drinking fluids throughout the day and adjusting for activity and climate.
Does the food pyramid account for vegetarian diets
Yes, the meat and beans group includes plant proteins such as beans, tofu, nuts, and seeds, allowing vegetarians to meet protein needs.
Insights, Analysis, and Developments
Editorial Note: The shift from the original Food Pyramid to MyPyramid and eventually to MyPlate represents more than just changing visual metaphors - it reflects our growing understanding that nutrition isn't one-size-fits-all. While the basic building blocks of healthy eating remain consistent across these models, the newer approaches acknowledge what grandmothers have always known: a teenager training for soccer needs different fuel than a retiree, and someone trying to manage diabetes faces different challenges than someone maintaining their current weight. The real value in these guides isn't just the numbers and servings, but the permission they give us to adapt nutritional wisdom to our own lives. Whether you're navigating dietary restrictions, working with a limited budget, or simply trying to feed a family with varying needs, these frameworks offer a starting point rather than a rigid prescription - and sometimes, that flexibility matters more than perfection.
 Author Credentials: Ian is the founder and Editor-in-Chief of Disabled World, a leading resource for news and information on disability issues. With a global perspective shaped by years of travel and lived experience, Ian is a committed proponent of the Social Model of Disability-a transformative framework developed by disabled activists in the 1970s that emphasizes dismantling societal barriers rather than focusing solely on individual impairments. His work reflects a deep commitment to disability rights, accessibility, and social inclusion. To learn more about Ian's background, expertise, and accomplishments, visit his full biography.