Printable Blood Sugar mmol/L to mg/dl Conversion Chart
Author: Ian C. Langtree - Writer/Editor for Disabled World (DW)
Published: 21 Aug 2023 - Updated: 2 Jun 2026
Publication Type: Charts, Graphs, Tables
Table of Contents:
Synopsis - Definition - Overview - Insights, Updates - Related Content
Synopsis
This information provides a printable reference chart and table for converting blood glucose readings between mmol/L and mg/dl, the two units most widely used to measure blood sugar concentration. Because mmol/L (millimoles per liter) is the international standard while mg/dl remains common in countries such as the United States, the table offers a practical side-by-side reference for people who need to read results across both systems. It applies the standard glucose conversion factor of 0.0555 and can be printed directly from the browser, making it a useful everyday tool for people managing diabetes, seniors tracking their levels, caregivers, and anyone who needs to interpret glucose values reported in an unfamiliar unit.
At a Glance
- 1 - The chart can be printed straight from a web browser using File then Print, or with the keyboard shortcut Command plus P on Mac and Ctrl plus P on Windows and Linux.
- 2 - All listed figures are approximate, as the mmol/L measurements have been shortened to three decimal places with no rounding applied.
- 3 - Readings above roughly 400 mg/dl, or 22.2 mmol/L, indicate severe hyperglycemia and would be treated as a medical emergency, though they are included for completeness rather than as typical values.
Topic Definition
- Blood Sugar Conversion
Blood sugar conversion is the process of translating a blood glucose reading from one unit of measurement to another, most commonly between millimoles per liter (mmol/L) and milligrams per deciliter (mg/dl). The mmol/L unit reflects molar concentration and is the international standard, while mg/dl expresses the weight of glucose in a given volume of blood and is widely used in the United States and a number of other countries. The two are linked by a fixed conversion factor of 0.0555, so a value in mg/dl multiplied by 0.0555 gives the equivalent in mmol/L, allowing the same result to be understood accurately regardless of which unit a meter or laboratory reports.
Overview
Our printable mmol/L to mg/dl table below forms part of our article on converting mmol/L to mg/dl blood sugar levels which also includes additional information on blood sugar concentration or blood glucose levels in the blood.
Blood Sugar mmol/L to mg/dl Conversion Table
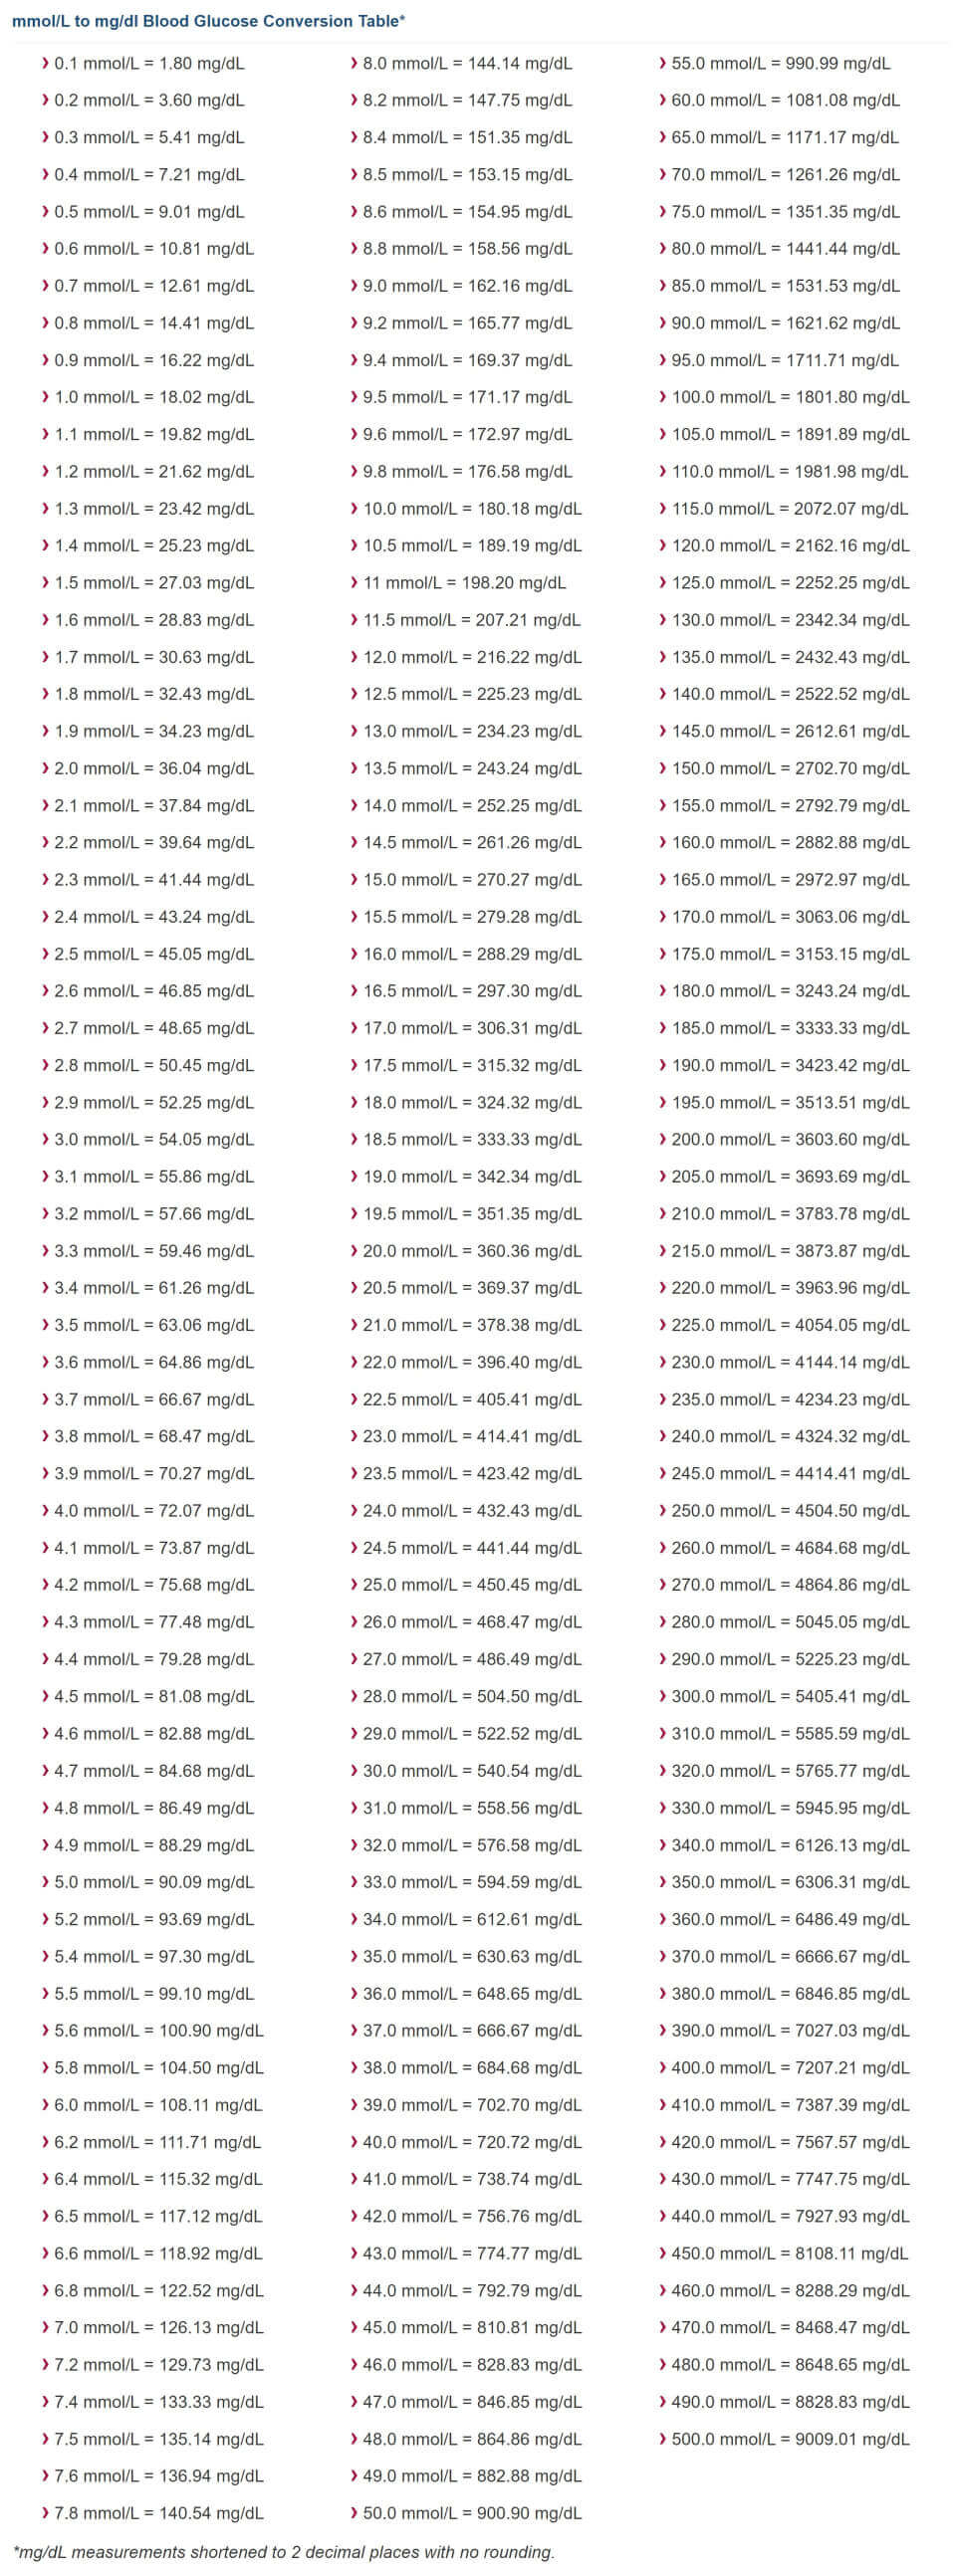
*All figures are approximate only as mmol/L measurements have been shortened to 3 decimal places with no rounding.
The conversion factor used is 0.0555, which is the standard factor for converting mg/dL to mmol/L for glucose measurements.
Note: Extremely high values (above about 400 mg/dL or 22.2 mmol/L) are considered severe hyperglycemia and would be medical emergencies in real-life situations. The higher values are included for completeness of the conversion table, but they do not represent normal or even common blood glucose levels.
How to Print the Chart
To print the above chart click "File" and then "Print". Or, use a keyboard shortcut:
Mac: Command-key + p
Windows and Linux: Ctrl + p
In the window that appears, select the destination and change your preferred print settings.
Click "Print".
Also see our Blood Sugar mg/dl to mmol/L Conversion Table
Insights, Analysis, and Developments
Editorial Note: A simple conversion chart can remove a surprising amount of confusion for anyone who moves between healthcare systems, travels internationally, or uses meters and lab reports that present results in different units. Keeping a printed copy near a glucose monitor or in a diabetes care kit gives a quick, reliable point of reference without needing to recalculate figures by hand or rely on a connected device. As always, the numbers here are a guide for interpreting readings rather than a substitute for the advice of a doctor or diabetes care team, who can place any individual result in the context of a person's overall health.
 Author Credentials: Ian is the founder and Editor-in-Chief of Disabled World, a leading resource for news and information on disability issues. With a global perspective shaped by years of travel and lived experience, Ian is a committed proponent of the Social Model of Disability-a transformative framework developed by disabled activists in the 1970s that emphasizes dismantling societal barriers rather than focusing solely on individual impairments. His work reflects a deep commitment to disability rights, accessibility, and social inclusion. To learn more about Ian's background, expertise, and accomplishments, visit his full biography.