2026 U.S. Disability Statistics: Adults and Children
Author: Ian C. Langtree - Writer/Editor for Disabled World (DW)
Published: 12 Apr 2026 - Updated: 13 Jun 2026
Publication Type: Data & Statistical Analysis
Table of Contents:
Synopsis - Definition - Overview - Insights, Updates - Related Content
Synopsis
Disability is not a fringe experience in America - it is a defining feature of daily life for tens of millions of people. Yet despite its enormous scope, disability remains poorly measured, inconsistently defined, and frequently overlooked in public discourse. This paper cuts through the confusion by presenting the most current federal data available, separating adult and childhood statistics into distinct sections, and explaining why different surveys produce different numbers - giving readers the clearest possible picture of how many Americans actually live with a disability and what that means for families, communities, and national policy.At a Glance
- 1 - Autism diagnoses have risen dramatically over time: about 1 in 31 eight-year-old children (3.2 percent) were identified with autism in 2022 surveillance data, up from 1 in 36 in 2020 and just 1 in 150 when the CDC first began tracking it among children born in the early 1990s.
- 2 - The two major federal surveys produce strikingly different prevalence estimates - the ACS reported 13.5 percent in 2023, while the phone-based BRFSS reported 28.7 percent for 2022, partly due to a "priming" effect where health-focused survey respondents think more about their limitations.
- 3 - Family income strongly correlates with childhood disability, with 18 percent of children in families below the poverty level reporting a disability compared to just 11 percent for children in families at or above 200 percent of the poverty level.
Topic Definition
- Defining Disability for Statistic Purposes
In the context of the statistics presented in this paper, disability refers to a person's self-reported or parent-reported serious difficulty in one or more functional areas of daily life. Federal surveys such as the American Community Survey and the Behavioral Risk Factor Surveillance System identify disability through six standardized questions covering hearing, vision, cognition (concentrating, remembering, or making decisions), mobility (walking or climbing stairs), self-care (dressing or bathing), and independent living (running errands alone). A person is counted as having a disability if they answer yes to at least one of these questions. For children, the questions may be limited depending on age, and additional measures - including the Washington Group Child Functioning Module and clinical diagnostic criteria used under the Individuals with Disabilities Education Act - capture developmental disabilities such as autism, ADHD, learning disabilities, and intellectual disabilities that the standard six-question set may not fully reflect.
Overview
Disability in the United States: How Many Americans Live With a Disability?
Disability is one of the most important public health topics in the United States, yet it remains one of the most misunderstood. Tens of millions of Americans - adults and children alike - navigate daily life with conditions that affect how they move, think, see, hear, or care for themselves. While conversations about disability have gained visibility in recent years, the actual numbers behind these experiences are often overlooked or poorly understood. This paper draws on the most current federal data available to present a clear picture of disability prevalence across the U.S. population, broken down by age group, type of disability, and demographic characteristics.
Understanding the Numbers: Two Major Federal Data Sources
Before diving into specific figures, it helps to understand why disability statistics sometimes look different depending on where you find them. Two of the most widely cited federal sources are the U.S. Census Bureau's American Community Survey (ACS) and the Centers for Disease Control and Prevention's Behavioral Risk Factor Surveillance System (BRFSS). Both surveys ask a similar set of six questions about difficulty with hearing, seeing, walking, cognition, self-care, and independent living. However, differences in how the surveys are conducted - including sample size, response rates, and whether interviews happen by phone, mail, or online - lead to different prevalence estimates (Centers for Disease Control and Prevention [CDC], 2024a).
The ACS, which surveys approximately 4.7 million people annually with a response rate near 85 percent, reported a disability prevalence of 13.5 percent in 2023 (Erickson et al., 2025). The BRFSS, a phone-based survey with about 400,000 respondents and a lower response rate, reported 28.7 percent for 2022 (CDC, 2024b). According to researchers at Cornell University and the Northeast ADA Center, part of this gap may also come from a "priming" effect - people responding to a health-focused survey like the BRFSS may be more inclined to think about their limitations than those answering a broad demographic survey like the ACS (Northeast ADA Center, 2025). Both figures are legitimate, and together they offer a fuller picture of disability in America.
Adults Living With Disabilities in the United States
Overall Adult Prevalence
According to the CDC's most recent BRFSS data, more than 1 in 4 adults in the United States - approximately 28.7 percent, or an estimated 70 million people - reported having some type of functional disability in 2022 (CDC, 2024b). That makes disability one of the most common health-related experiences in American life. To put that number in perspective, the total civilian noninstitutionalized adult population in the United States was approximately 260 million during that period.
The ACS provides a somewhat lower but still substantial figure. Based on 2023 ACS data, approximately 44.68 million civilians of all ages in the community reported one or more disabilities, representing 13.5 percent of the noninstitutionalized population (Erickson et al., 2025). When the ACS sample is adjusted to focus only on adults aged 18 and older - to better match the BRFSS population - the prevalence rises to approximately 16 percent, which narrows some of the gap between the two surveys (Northeast ADA Center, 2025).
Disability by Type Among Adults
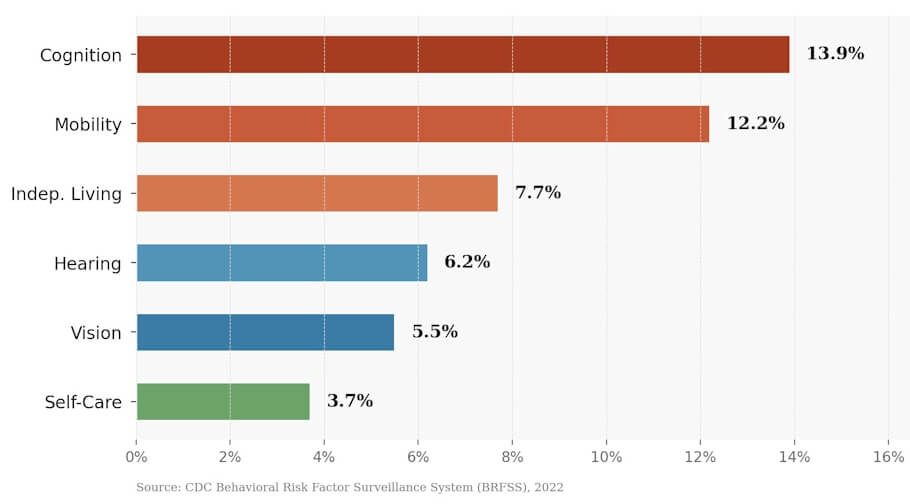
The BRFSS breaks disability down into six functional categories, each reflecting a different dimension of daily life. The most commonly reported disability type among adults in 2022 was cognitive disability, defined as serious difficulty concentrating, remembering, or making decisions, at 13.9 percent. This figure increased noticeably from 12.8 percent in 2021, a trend that some researchers have linked to the lingering effects of COVID-19 on brain health (CDC, 2024b).
Mobility disability - serious difficulty walking or climbing stairs - was the second most prevalent at 12.2 percent. Independent living disability, meaning difficulty running errands alone, affected 7.7 percent of adults. Hearing disability, defined as deafness or serious difficulty hearing, was reported by 6.2 percent. Vision disability, meaning blindness or serious difficulty seeing even with corrective lenses, affected 5.5 percent. And self-care disability, which involves difficulty dressing or bathing, was reported by 3.7 percent of adults (CDC, 2024b).
From the ACS perspective, using 2023 data for the entire population, ambulatory disability was the most commonly reported type at 6.3 percent (about 20.78 million people), followed by cognitive disability at 5.4 percent (about 17.97 million), independent living disability at 4.8 percent (about 15.79 million), hearing disability at 3.7 percent (about 12.07 million), vision disability at 2.5 percent (about 8.29 million), and self-care disability at 2.4 percent (about 8.02 million) (Erickson et al., 2025).
Disability by Age
Disability prevalence rises substantially with age. Among adults aged 18 to 29, approximately 8.7 percent reported a disability in the 2023 ACS. That figure held relatively steady through the 30 to 39 age group at 8.2 percent, then climbed to 9.5 percent for those aged 40 to 49 and 14.5 percent for those aged 50 to 59. By ages 60 to 64, nearly one in five adults - 19.4 percent - reported a disability (AskEARN, 2025). Among people aged 65 and older, the BRFSS found that 43.9 percent reported a disability, making this the age group with the highest prevalence by a wide margin (CDC, 2024b).
Disability by Race and Ethnicity
Disability does not affect all racial and ethnic groups equally. According to ACS estimates, American Indian and Alaska Native populations had the highest disability prevalence at approximately 18 percent. White and Black Americans both reported disability at around 14 percent. Hispanic Americans reported disability at roughly 10 percent, and Asian Americans at about 8 percent (Pew Research Center, 2023). These disparities reflect a combination of factors including differences in occupational risk, access to healthcare, socioeconomic conditions, and historical patterns of environmental exposure.
Long COVID and Disability
The 2022 BRFSS was the first time the survey collected data on Long COVID - symptoms lasting three months or longer after an initial COVID-19 infection. The results revealed a significant connection between disability and Long COVID: 10.8 percent of adults with disabilities reported experiencing Long COVID symptoms, compared to 6.6 percent of adults without disabilities (CDC, 2024b). While the exact mechanisms behind this association are still being studied, the finding reinforced concerns that the pandemic may have both created new disabilities and worsened existing ones.
Employment and Education Among Adults With Disabilities
Working-age adults with disabilities face significant gaps in both employment and education compared to their nondisabled peers. According to 2023 ACS data, people with disabilities accounted for 6.8 percent of all employees aged 18 to 64. Employment rates varied dramatically by disability type: 59.4 percent of people with hearing disabilities were employed, compared to just 17.9 percent of those with self-care disabilities (AskEARN, 2025).
Education gaps are also stark. In 2024, 16.4 percent of individuals aged 25 and over with disabilities had less than a high school education, compared to 8.8 percent of those without disabilities - making people with disabilities 1.9 times more likely to lack a high school diploma. At the other end, just 13.4 percent of adults with disabilities held a four-year college degree, compared to 24 percent of adults without disabilities (Center for Research on Disability, 2026).
Children Living With Disabilities in the United States
Overall Prevalence Among Children
Estimating the number of children with disabilities in the United States is complicated by the fact that different surveys use different definitions and age ranges. The National Health Interview Survey (NHIS), conducted by the CDC's National Center for Health Statistics, reported in its 2020-2021 data that approximately 13 percent of children aged 5 to 17 had a disability. Rates were slightly higher for boys (14 percent) than for girls (12 percent) (Federal Interagency Forum on Child and Family Statistics, 2023).
The ACS provides estimates for younger age groups as well, though children under age 5 are only asked about vision and hearing difficulties. For children aged 5 to 15, the 2023 ACS found a disability prevalence in line with the roughly 6 percent figure seen in prior years, while the rate for those aged 16 to 20 was somewhat higher, consistent with the broader challenges of adolescence and early adulthood (Erickson et al., 2025).
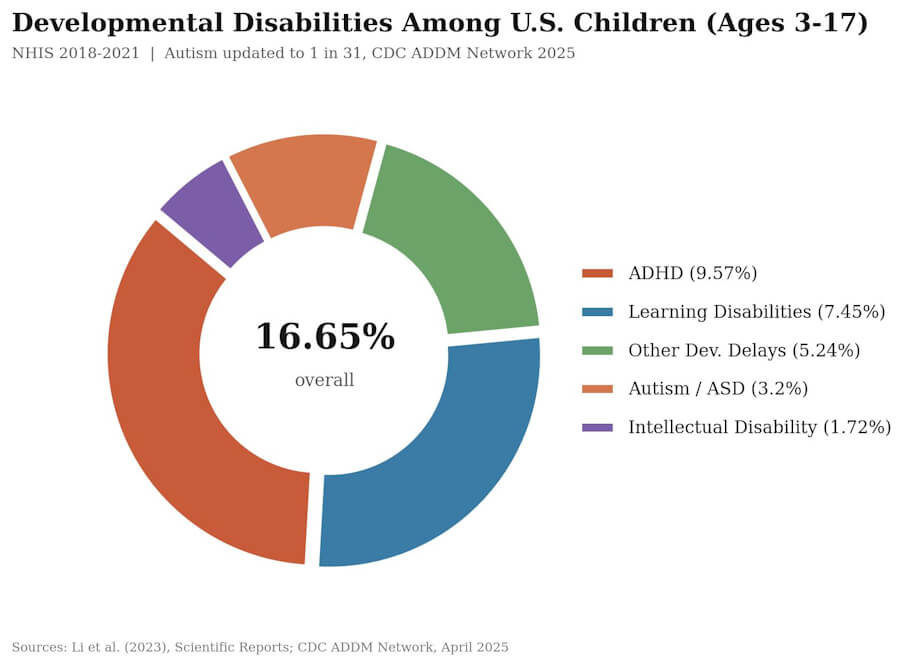
A peer-reviewed study published in Scientific Reports using NHIS data from 2018 to 2021 estimated that 16.65 percent of children and adolescents aged 3 to 17 had a developmental disability of some kind, including ADHD, learning disabilities, autism, intellectual disability, and other developmental delays (Li et al., 2023).
Children With Developmental Disabilities
Developmental disabilities represent the largest category of childhood disability in the United States. According to the NHIS data analyzed by Li et al. (2023), ADHD was the most commonly identified developmental disability among children aged 3 to 17, with a prevalence of 9.57 percent. Learning disabilities followed at 7.45 percent, other developmental delays at 5.24 percent, autism spectrum disorder at 2.94 percent, and intellectual disability at 1.72 percent.
These rates have been trending upward for years. The prevalence of any developmental disability among U.S. children rose from 16.22 percent during 2009-2011 to 17.76 percent during 2015-2017, reflecting a combination of improved screening, broadened diagnostic criteria, and greater awareness among both parents and clinicians (Li et al., 2023).
Autism Spectrum Disorder: A Rapidly Rising Diagnosis
No childhood disability statistic has drawn more public attention than autism. In April 2025, the CDC released updated data from its Autism and Developmental Disabilities Monitoring (ADDM) Network showing that approximately 1 in 31 eight-year-old children - or 3.2 percent - were identified with autism spectrum disorder (ASD) based on 2022 surveillance data. That represents a notable increase from the previously reported rate of 1 in 36 based on 2020 data, and a dramatic rise from 1 in 150 when the CDC first began tracking autism prevalence among children born in the early 1990s (Shaw et al., 2025).
The gender gap in autism identification remains significant: boys were 3.4 times more likely than girls to be identified with ASD, with a prevalence of 49.2 per 1,000 among boys compared to 14.3 per 1,000 among girls. Racial and ethnic patterns have also shifted in recent years. For the first time in the ADDM Network's history, Asian or Pacific Islander, Black, Hispanic, and multiracial children all had higher ASD prevalence than White children, suggesting that diagnostic access has expanded into communities that were historically underserved (Shaw et al., 2025).
Learning Disabilities
A 2025 study published in PLOS ONE using National Survey of Children's Health data from 2016 to 2023 found that 8.85 percent of U.S. children aged 6 to 17 had a parent-reported history of learning disability diagnosis. The study noted an upward trend in learning disability prevalence over the eight-year period, with notable variation by state (Weeks et al., 2025). Separately, the National Center for Learning Disabilities has estimated that as many as 20 percent of U.S. children have some type of learning or thinking difference, though not all of these meet the threshold for a clinical diagnosis (National Center for Learning Disabilities, 2024).
Children Served Under IDEA
Perhaps the most concrete measure of childhood disability comes from the Individuals with Disabilities Education Act (IDEA), which mandates free and appropriate public education for eligible students aged 3 to 21. According to the National Center for Education Statistics, approximately 7.5 million students were served under IDEA Part B during the 2022-23 school year, representing 15 percent of total public school enrollment. That number has grown steadily from 6.4 million students (13 percent of enrollment) in the 2012-13 school year (National Center for Education Statistics [NCES], 2024).
In the fall of 2022, approximately 67.76 million people aged 6 to 21 were enrolled in school in the United States. Of these, 7.08 million - or 10.5 percent - received special education services under IDEA Part B. The percentage varied considerably by state, from 7 percent in Hawaii to 13.9 percent in Maine (Center for Research on Disability, 2025).
Income and Childhood Disability
Family income plays a significant role in childhood disability prevalence. NHIS data show that children in families with incomes below the poverty level reported disability at a rate of 18 percent, compared to 15 percent for those at 100 to 199 percent of poverty and 11 percent for children in families at or above 200 percent of the poverty level (Federal Interagency Forum on Child and Family Statistics, 2023). This gradient likely reflects a combination of increased exposure to environmental risk factors, reduced access to prenatal and pediatric care, and the compounding effects of socioeconomic disadvantage on child development.
The Broader Picture: Disability as Part of American Life
Taken together, the data paint a clear picture: disability is woven into the fabric of American society. It touches every age group, every racial and ethnic community, and every income level. The CDC has noted that disability should not be viewed as a health outcome but rather as a part of how people experience life - encompassing the ways people hear, see, move, process information, and care for themselves (CDC, 2024a).
The numbers have been rising over time, driven in part by an aging population, improved diagnostic tools, greater public awareness of conditions like autism and ADHD, and the health consequences of COVID-19. Between the ACS estimate of 44.68 million civilians with disabilities and the BRFSS estimate of over 70 million adults alone, the scope of disability in America is enormous. Factor in the millions of children receiving special education services and the millions more with developmental disabilities, and it becomes clear that disability policy, accessibility, and inclusion are among the most consequential issues facing the nation.
References
- AskEARN. (2025). Statistics on disability. Employer Assistance and Resource Network on Disability Inclusion.
- Center for Research on Disability. (2025). 2025 annual disability statistics compendium. University of New Hampshire, Institute on Disability.
- Center for Research on Disability. (2026). 2026 annual disability statistics compendium. University of New Hampshire, Institute on Disability.
- Centers for Disease Control and Prevention. (2024a). Disability and health data now. National Center on Birth Defects and Developmental Disabilities.
- Centers for Disease Control and Prevention. (2024b). Disability impacts all of us [Infographic]. National Center on Birth Defects and Developmental Disabilities.
- Erickson, W., Lee, C., and von Schrader, S. (2025). 2023 disability status report: United States. Cornell University Yang-Tan Institute on Employment and Disability.
- Federal Interagency Forum on Child and Family Statistics. (2023). America's children: Key national indicators of well-being, 2023 - Disability.
- Li, Y., Wang, Y., and Chen, X. (2023). Prevalence and trends of developmental disabilities among US children and adolescents aged 3 to 17 years, 2018-2021. Scientific Reports, 13, 17562.
- National Center for Education Statistics. (2024). Students with disabilities. Condition of Education. U.S. Department of Education, Institute of Education Sciences.
- National Center for Learning Disabilities. (2024). The state of learning disabilities: Data, disparities, and directions for change. NCLD Research Report.
- Northeast ADA Center. (2025). How common is disability among adults in the US? Understanding survey differences.
- Pew Research Center. (2023). 8 facts about Americans with disabilities.
- Shaw, K. A., Williams, S., Patrick, M. E., et al. (2025). Prevalence and early identification of autism spectrum disorder among children aged 4 and 8 years - Autism and Developmental Disabilities Monitoring Network, 16 sites, United States, 2022. MMWR Surveillance Summaries, 74(SS-2), 1-22.
- Weeks, J. D., Madans, J. H., Black, L. I., Elgaddal, N., and Zablotsky, B. (2025). Difficulties in functioning among children in the United States: 2021-2023. National Health Statistics Reports, (218), 1-20.
Insights, Analysis, and Developments
Editorial Note: The statistics presented throughout this paper reflect a reality that policymakers, educators, healthcare providers, and employers cannot afford to ignore: disability touches every corner of American life, from the youngest children entering special education classrooms to the oldest adults managing multiple functional limitations. As diagnostic tools improve, awareness expands, and the long-term health effects of COVID-19 continue to surface, these numbers are likely to keep climbing - making investment in accessibility, inclusion, and support services not just a moral imperative but an economic and social necessity for the nation's future. Author Credentials: Ian is the founder and Editor-in-Chief of Disabled World, a leading resource for news and information on disability issues. With a global perspective shaped by years of travel and lived experience, Ian is a committed proponent of the Social Model of Disability-a transformative framework developed by disabled activists in the 1970s that emphasizes dismantling societal barriers rather than focusing solely on individual impairments. His work reflects a deep commitment to disability rights, accessibility, and social inclusion. To learn more about Ian's background, expertise, and accomplishments, visit his full biography.