Female Toddler Height Weight Chart 12-23 Months Age
Author: Ian C. Langtree - View Credentials
Published: 21 Aug 2023 - Updated: 19 Sep 2026
Publication Type: Charts, Graphs, Tables
Table of Contents:
Synopsis - Definition - Overview - FAQs - Insights, Updates - Related Content
Synopsis
This reference chart provides month-by-month height and weight measurements for female toddlers between 12 and 23 months of age, sourced from authoritative health organizations including the World Health Organization (WHO), the National Institutes of Health, and the Centers for Disease Control and Prevention. The data offers parents, caregivers, and healthcare providers a reliable baseline for tracking developmental milestones during this critical growth period. Presenting measurements in both imperial and metric formats makes the information accessible to families worldwide, while the straightforward table format allows for quick reference during pediatric appointments or home monitoring. Parents of children with disabilities or developmental concerns will find this particularly helpful for identifying potential growth variations that may warrant medical consultation, though the chart appropriately notes that individual measurements can naturally fall above or below these averages.
At a Glance
- 1 - BMI is not routinely calculated before two years of age, so weight-for-length is used instead. Clinicians switch to BMI-for-age once a child is measured standing.
- 2 - Most guidance suggests around 16 to 24 ounces of whole milk a day after the first birthday, alongside varied solid foods. Very large intakes can displace iron-rich foods and contribute to iron deficiency.
- 3 - A premature toddler is usually plotted using corrected age rather than calendar age until roughly two years. Many children born early show catch-up growth during this period, which a pediatrician tracks separately.
- 4 - Genetics largely set the curve a toddler tends to follow, while nutrition, sleep, activity, and general health determine how closely she stays on it. Persistent shortfalls or an untreated condition can pull growth below her expected pattern.
- Female Toddler Growth Chart
A female toddler growth chart is a reference table that lays out the average height and weight expected for girls between roughly one and two years of age, here covering 12 through 23 months. Rather than serving as a pass-or-fail test, it collects averages from large population studies so parents, caregivers, and doctors can see where a toddler sits alongside others her age. Its value comes from watching the pattern over time, since healthy toddlers grow along their own curves shaped by genetics, nutrition, activity, and any underlying health conditions. A girl's numbers can sit comfortably above or below the average and still be perfectly normal, which is why a chart like this works best as a starting point for tracking progress and for guiding a conversation with a pediatrician who can weigh the figures against her full health picture.
- 1 - World Health Organization: Child Growth Standards - overview of the standards used from birth to 23 months.
- 2 - World Health Organization: Weight-for-age - z-score and percentile tables, birth to 5 years.
- 3 - World Health Organization: Length/height-for-age - z-score and percentile tables, birth to 5 years.
- 4 - U.S. Centers for Disease Control and Prevention: WHO growth standards for use in US infants and children birth to 2 years - the basis for using WHO figures below age two.
Topic Definition
Overview
Understanding Height and Weight Changes in Toddler Girls
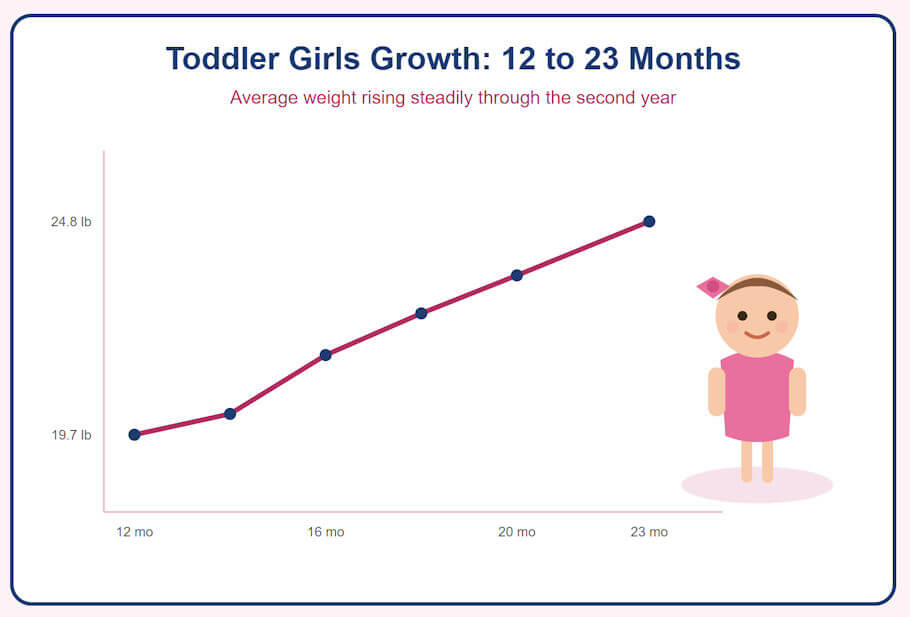
Female toddlers come in all shapes and sizes, so it is not always easy to know if your girl is following a healthy path regarding height and weight. However, keep in mind that the numbers in these types of charts are just a benchmark. Your girls' weight and height can often be higher or lower than the average.
| Age | Weight | Length |
|---|---|---|
| 12 Months | 19.7 lb. (8.95 kg) | 29.1" (74.0 cm) |
| 13 Months | 20.2 lb. (9.17 kg) | 29.6" (75.2 cm) |
| 14 Months | 20.7 lb. (9.39 kg) | 30.1" (76.4 cm) |
| 15 Months | 21.2 lb. (9.60 kg) | 30.5" (77.5 cm) |
| 16 Months | 21.6 lb. (9.81 kg) | 30.9" (78.6 cm) |
| 17 Months | 22.1 lb. (10.02 kg) | 31.4" (79.7 cm) |
| 18 Months | 22.6 lb. (10.23 kg) | 31.8" (80.7 cm) |
| 19 Months | 23.0 lb. (10.44 kg) | 32.2" (81.7 cm) |
| 20 Months | 23.5 lb. (10.65 kg) | 32.6" (82.7 cm) |
| 21 Months | 23.9 lb. (10.85 kg) | 33.0" (83.7 cm) |
| 22 Months | 24.4 lb. (11.06 kg) | 33.3" (84.6 cm) |
| 23 Months | 24.8 lb. (11.27 kg) | 33.7" (85.5 cm) |
Frequently Asked Questions
Why does the chart switch from length to standing height after two years of age
Recumbent length is used while a child cannot stand still and straighten fully, and standing height is generally adopted from about 24 months. Standing height usually reads slightly less than length, so charts note which method applies to avoid a false drop in the curve.
What does BMI mean for a toddler girl and is it useful at this age
BMI is not routinely calculated before two years of age, so weight-for-length is used instead to see whether a toddler's weight suits her size. Clinicians switch to BMI-for-age once a child is measured standing.
Is it normal for a toddler girl to change percentiles during her second year
Some shifting is common up to about 24 months as a child settles onto the curve set by her genetics rather than her birth size. A clinician pays attention when a child crosses two or more major percentile lines in the same direction over several visits.
How much milk should a toddler girl drink and can too much affect growth
Most guidance suggests around 16 to 24 ounces of whole milk a day after the first birthday, alongside varied solid foods. Very large milk intakes can fill her up, displace iron-rich foods, and contribute to iron deficiency.
How is a premature toddler girl plotted on this kind of chart
Measurements for a child born preterm are usually plotted using corrected age rather than calendar age until roughly two years. Many children born early show catch-up growth during this period, and a pediatrician tracks that trajectory separately.
Do teething, illness, or a growth spurt explain short term weight changes
Yes, a stomach bug, an ear infection, teething discomfort, or a burst of new activity can all flatten weight gain for a few weeks. Weight typically recovers once she is well, while length keeps rising more steadily.
Should shoes and clothing be removed before measuring a toddler
Yes, shoes, bulky clothing, hair accessories, and a wet diaper all distort readings, so measure barefoot in light clothing. Using the same scale and the same time of day makes comparisons between checkups more meaningful.
Do genetics or nutrition matter more for a toddler girl's size
Genetics largely set the curve she tends to follow, while nutrition, sleep, activity, and general health determine how closely she stays on it. Persistent nutritional shortfalls or an untreated medical condition can pull growth below her expected pattern.
How These Figures Were Derived and Last Verified
Every number in the table above is the median (50th percentile) of a published growth reference, not an average of site visitors or an in-house estimate. The figures come from the WHO Child Growth Standards, which the CDC recommends for children under two years of age in the United States. In each row the imperial and metric values are converted from the source figure in its original unit and rounded consistently, so the two unit systems agree with one another. The complete set of figures was last checked cell by cell against the source data files on 26 July 2026, and matches our full height-to-weight guide for infants through teens.
Source References
Other Printable Height to Weight Reference Charts:
Insights, Analysis, and Developments
Editorial Note: Growth charts remain one of pediatric medicine's most practical tools, yet their real value lies not in rigid adherence to averages but in revealing patterns over time. While these WHO and CDC benchmarks reflect typical development for female toddlers, every child follows her own trajectory influenced by genetics, nutrition, activity levels, and underlying health conditions. What matters most isn't whether a toddler hits exact numbers at specific months, but rather that she maintains consistent progress along her personal growth curve. For families raising children with disabilities or chronic conditions that affect growth - whether related to nutrition absorption, mobility, or metabolic function - these charts become conversation starters rather than judgment tools, helping healthcare teams identify when intervention might optimize development and when patience simply allows nature to unfold at its own pace.
 Author Credentials: Ian C. Langtree is a writer, editor, and the founder and Editor-in-Chief of Disabled World, which he established in 2004 as one of the longest-running independent resources for disability news and information. Over more than two decades, he has written and edited thousands of articles on disability rights, health, accessibility, and assistive technology. Drawing on a global perspective shaped by extensive travel and lived experience, Ian is a committed advocate of the Social Model of Disability, the framework developed by disabled activists in the 1970s that focuses on removing societal barriers rather than on individual impairments. His writing is grounded in that framework and in a lasting commitment to disability rights, accessibility, and social inclusion. To learn more about Ian's background, expertise, and accomplishments, visit his full biography.