Baby Girl Growth Chart: Height & Weight Birth to 11 Months
Author: Ian C. Langtree - Writer/Editor for Disabled World (DW)
Published: 21 Aug 2023 - Updated: 10 Jul 2026
Publication Type: Conversion, Calculation
Table of Contents:
Synopsis - Definition - Overview - FAQs - Insights, Updates - Related Content
Synopsis
This information provides essential reference data for monitoring the physical development of female infants during their first year of life. Drawing from authoritative sources including the World Health Organization, the National Institutes of Health's Gerontology Research Center, and the U.S. Centers for Disease Control and Prevention, the chart presents monthly averages for both weight and length measurements from birth through eleven months. Parents, pediatricians, and caregivers can use these benchmarks to track growth patterns while understanding that healthy babies naturally vary in size and that percentile rankings don't automatically indicate developmental concerns. The resource proves particularly valuable for families managing medical conditions or disabilities where growth monitoring requires closer attention, offering a quick reference tool that helps identify when consultation with healthcare providers might be warranted.At a Glance
- 1 - Average newborn girls measure 7.3 lb (3.31 kg) and 19.4" (49.2 cm).
- 2 - By 11 months the average girl reaches about 19.9 lb (9.03 kg) and 28.7" (72.8 cm).
- 3 - Chart data is drawn from the World Health Organization, the National Institutes of Health, and the U.S. Centers for Disease Control and Prevention.
Topic Definition
- Baby Girl Growth Chart
A baby girl growth chart is a reference table that sets out the average height and weight expected for female infants across their first year, here spanning birth through eleven months. Instead of acting as a strict target every child must hit, it pulls together averages from large population studies so parents, caregivers, and doctors can see roughly where a baby girl sits next to others her age. Its real worth lies in following the overall trend, since healthy babies grow along their own curves shaped by genetics, feeding, activity, and any underlying conditions. Steady weight gain is a reassuring sign that a baby is feeding well, and a chart like this works best as a starting point for tracking development and for guiding a conversation with a pediatrician who can read the numbers against a baby's full health picture.
Overview
Tracking Your Baby Girl's Height and Weight in the First Year
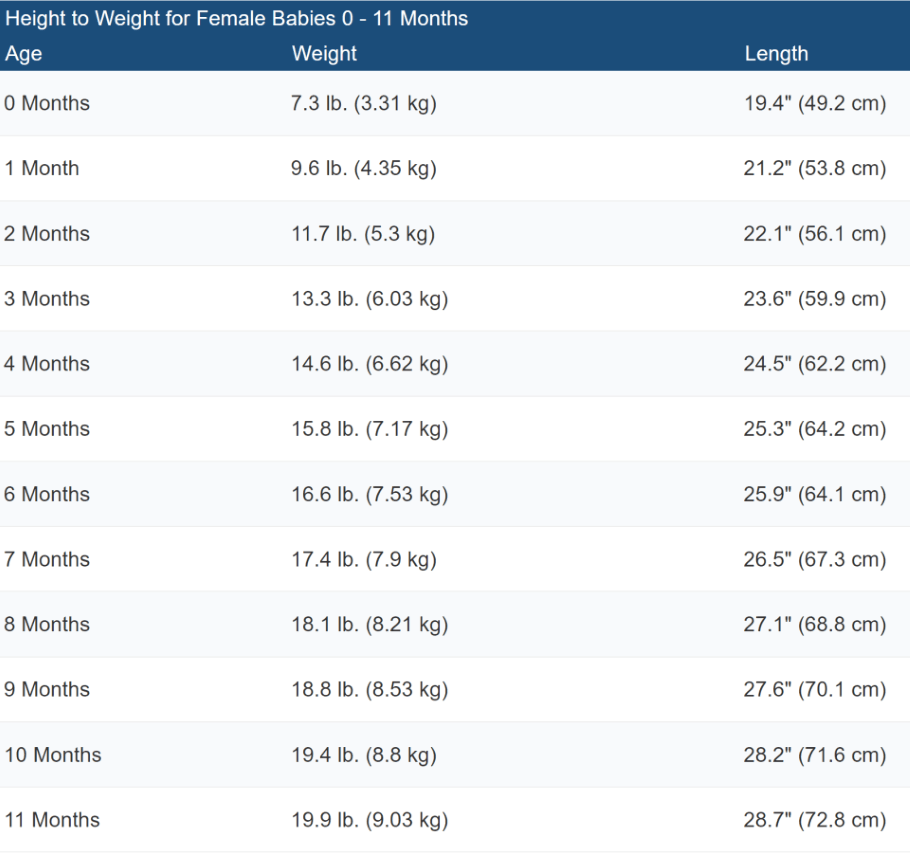
Babies come in all shapes and sizes. If a baby's weight is in a lower - or higher - percentile, this does not necessarily signal a problem with their growth or physical development. A height to weight chart, like the one below, can help you track your baby girls' growth, as steady weight gain is a sign that your baby is healthy and feeding well.
| Age | Weight | Length |
|---|---|---|
| 0 Months | 7.3 lb. (3.31 kg) | 19.4" (49.2 cm) |
| 1 Month | 9.6 lb. (4.35 kg) | 21.2" (53.8 cm) |
| 2 Months | 11.7 lb. (5.3 kg) | 22.1" (56.1 cm) |
| 3 Months | 13.3 lb. (6.03 kg) | 23.6" (59.9 cm) |
| 4 Months | 14.6 lb. (6.62 kg) | 24.5" (62.2 cm) |
| 5 Months | 15.8 lb. (7.17 kg) | 25.3" (64.2 cm) |
| 6 Months | 16.6 lb. (7.53 kg) | 25.9" (64.1 cm) |
| 7 Months | 17.4 lb. (7.9 kg) | 26.5" (67.3 cm) |
| 8 Months | 18.1 lb. (8.21 kg) | 27.1" (68.8 cm) |
| 9 Months | 18.8 lb. (8.53 kg) | 27.6" (70.1 cm) |
| 10 Months | 19.4 lb. (8.8 kg) | 28.2" (71.6 cm) |
| 11 Months | 19.9 lb. (9.03 kg) | 28.7" (72.8 cm) |
Printable Height to Weight Chart for Female Babies From Birth to 11 Months of Age
Other Printable Height to Weight Reference Charts:
*Information and data for above growth charts sourced from The World Health Organization (WHO), Gerontology Research Center (National Institutes of Health (NIH), USA), and the U.S. Centers for Disease Control and Prevention (CDC).
Frequently Asked Questions
What does a growth percentile actually mean for my baby girl?
A percentile simply shows how your baby compares to a large group of babies the same age, so the 50th percentile is close to average. A lower or higher percentile is not automatically good or bad, since what matters most is steady growth along her own curve.
How often should my baby girl be weighed and measured?
Length and weight are typically recorded at scheduled well-baby visits, which come often during the first year. Daily home weighing is rarely needed, as regular checkups paired with good feeding and wet diapers tell you more than any single reading.
Does feeding method change how a baby girl grows?
Yes, breastfed and formula-fed babies can follow slightly different growth patterns, particularly in the early months. Both patterns can be perfectly healthy, and a pediatrician takes feeding into account when reviewing the chart.
Do baby girls and baby boys grow at different rates?
Yes, girls and boys tend to have slightly different average weights and lengths, which is why separate charts are used for each. Baby girls often start a little smaller than boys, so comparing a girl to boy averages can be misleading.
My baby girl's growth slowed for a month, should I worry?
A brief slowdown can follow illness, teething, or a recent growth spurt and is often nothing to worry about. A sustained flattening across several checkups is more meaningful and worth discussing with your pediatrician.
Are these averages suitable for premature baby girls?
Premature infants are usually plotted using their corrected age rather than calendar age for the first couple of years. This gives a fairer comparison, and a pediatrician will interpret her measurements with prematurity in mind.
Insights, Analysis, and Developments
Editorial Note: Growth charts serve as guides rather than rigid standards, yet they remain one of the most practical tools parents have for understanding their child's development trajectory. While these WHO and CDC-sourced measurements reflect population averages, real-world pediatric care recognizes that thriving infants follow their own unique growth curves. What matters most isn't hitting exact numbers at precise intervals, but rather showing consistent progress over time. For families dealing with medical complexities, chronic conditions, or feeding challenges, these monthly benchmarks become even more significant as they help distinguish between normal variation and patterns that warrant medical attention, making routine check-ups more productive and giving caregivers concrete data to discuss with their healthcare team. Author Credentials: Ian is the founder and Editor-in-Chief of Disabled World, a leading resource for news and information on disability issues. With a global perspective shaped by years of travel and lived experience, Ian is a committed proponent of the Social Model of Disability-a transformative framework developed by disabled activists in the 1970s that emphasizes dismantling societal barriers rather than focusing solely on individual impairments. His work reflects a deep commitment to disability rights, accessibility, and social inclusion. To learn more about Ian's background, expertise, and accomplishments, visit his full biography.