Girls Height Weight Chart: Birth to 20 Years Printable
Author: Ian C. Langtree - View Credentials
Published: 21 Aug 2023 - Updated: 19 Sep 2026
Publication Type: Charts, Graphs, Tables
Table of Contents:
Synopsis - Definition - Overview - FAQs - Insights, Updates - Related Content
Synopsis
This information provides a detailed reference chart displaying average height and weight measurements for girls from birth through twenty years of age, organized in easy-to-read tables spanning infancy, toddler years, childhood, and adolescence. The resource proves particularly valuable for parents monitoring their child's growth trajectory, healthcare providers assessing pediatric development, and caregivers of children with disabilities who may need to track growth patterns more closely due to medical conditions, medications, or mobility challenges that can affect typical development. The printable format allows families and medical professionals to maintain accessible records for comparing actual measurements against population averages over time, while the metric and imperial conversions accommodate international users and different healthcare systems.
At a Glance
- 1 - A common shortcut for a girl's adult height takes the father's height minus 5 inches, adds the mother's height, then divides by two. It still carries a margin of several inches.
- 2 - The roughly 2 pound jump between the 23-month row and the 2-year row is not a growth spurt. It marks the switch from WHO standards to CDC charts, built from different populations.
- 3 - Most girls reach their adult height around 14 to 16 years, usually within two to three years after their first period. Height changes very little after about age 16 while weight keeps rising slowly.
- 4 - School-age children generally need about 9 to 12 hours of sleep and teenagers about 8 to 10, because growth hormone peaks during deep sleep. Adolescent girls also have higher calcium and iron needs, the latter once menstruation starts.
Topic Definition
- Girls Growth Chart
A girls growth chart is a standardized reference tool that maps the average height and weight of female children at each stage of development, from newborns through age twenty. Doctors, parents, and caregivers use it to compare a child's actual measurements against population averages, making it easier to spot healthy growth patterns or flag changes that may need a closer look. Rather than acting as a strict pass-or-fail benchmark, the chart works as a guidepost, since a child's size is shaped by genetics, nutrition, activity, and overall health. It is especially useful for families of children with disabilities or chronic conditions, where consistent tracking during medical visits helps healthcare teams tell the difference between normal variation and trends worth discussing.
Overview
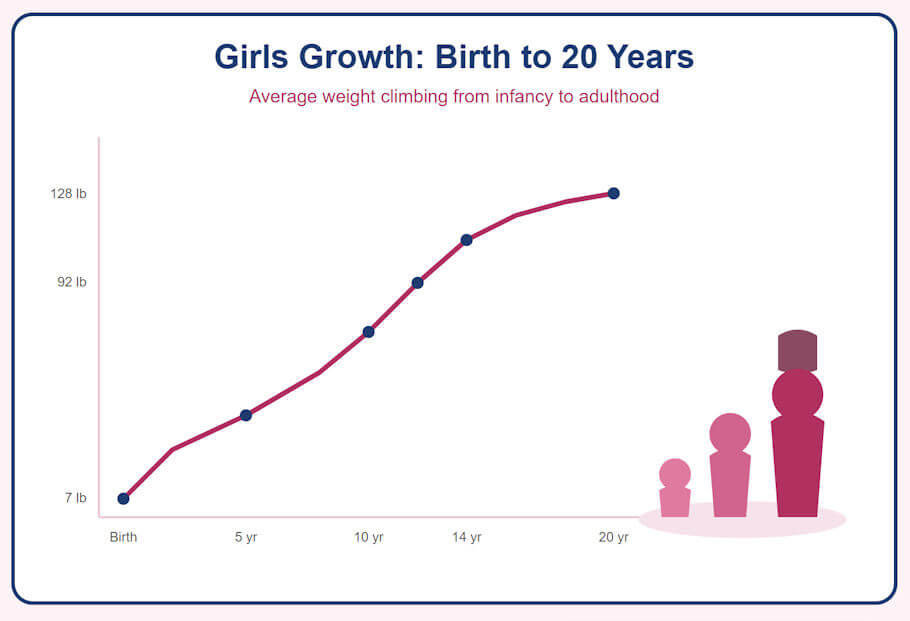
Our printable table below forms part of our average height to weight chart - babies to teenagers, and outlines the average weight to height ratio for girls aged from birth to twenty (20) years old.
| Age | Weight | Length |
|---|---|---|
| Birth | 7.1 lb (3.23 kg) | 19.3" (49.1 cm) |
| 1 Month | 9.2 lb (4.19 kg) | 21.1" (53.7 cm) |
| 2 Months | 11.3 lb (5.13 kg) | 22.5" (57.1 cm) |
| 3 Months | 12.9 lb (5.85 kg) | 23.5" (59.8 cm) |
| 4 Months | 14.2 lb (6.42 kg) | 24.4" (62.1 cm) |
| 5 Months | 15.2 lb (6.90 kg) | 25.2" (64.0 cm) |
| 6 Months | 16.1 lb (7.30 kg) | 25.9" (65.7 cm) |
| 7 Months | 16.8 lb (7.64 kg) | 26.5" (67.3 cm) |
| 8 Months | 17.5 lb (7.95 kg) | 27.1" (68.8 cm) |
| 9 Months | 18.1 lb (8.23 kg) | 27.6" (70.1 cm) |
| 10 Months | 18.7 lb (8.48 kg) | 28.1" (71.5 cm) |
| 11 Months | 19.2 lb (8.72 kg) | 28.7" (72.8 cm) |
| Toddler Girls (12-23 Months) | ||
| Age | Weight | Length |
| 12 Months | 19.7 lb (8.95 kg) | 29.1" (74.0 cm) |
| 13 Months | 20.2 lb (9.17 kg) | 29.6" (75.2 cm) |
| 14 Months | 20.7 lb (9.39 kg) | 30.1" (76.4 cm) |
| 15 Months | 21.2 lb (9.60 kg) | 30.5" (77.5 cm) |
| 16 Months | 21.6 lb (9.81 kg) | 30.9" (78.6 cm) |
| 17 Months | 22.1 lb (10.02 kg) | 31.4" (79.7 cm) |
| 18 Months | 22.6 lb (10.23 kg) | 31.8" (80.7 cm) |
| 19 Months | 23.0 lb (10.44 kg) | 32.2" (81.7 cm) |
| 20 Months | 23.5 lb (10.65 kg) | 32.6" (82.7 cm) |
| 21 Months | 23.9 lb (10.85 kg) | 33.0" (83.7 cm) |
| 22 Months | 24.4 lb (11.06 kg) | 33.3" (84.6 cm) |
| 23 Months | 24.8 lb (11.27 kg) | 33.7" (85.5 cm) |
| Girls Ages 2-12 | ||
| Age | Weight | Height |
| 2 Years | 26.8 lb (12.16 kg) | 33.6" (85.3 cm) |
| 3 Years | 30.7 lb (13.93 kg) | 37.1" (94.2 cm) |
| 4 Years | 35.0 lb (15.88 kg) | 39.8" (101.1 cm) |
| 5 Years | 39.7 lb (18.01 kg) | 42.5" (108.0 cm) |
| 6 Years | 44.8 lb (20.32 kg) | 45.3" (115.1 cm) |
| 7 Years | 50.4 lb (22.86 kg) | 47.9" (121.7 cm) |
| 8 Years | 56.8 lb (25.76 kg) | 50.3" (127.8 cm) |
| 9 Years | 64.2 lb (29.12 kg) | 52.4" (133.1 cm) |
| 10 Years | 72.9 lb (33.07 kg) | 54.4" (138.2 cm) |
| 11 Years | 82.4 lb (37.38 kg) | 56.8" (144.3 cm) |
| 12 Years | 92.2 lb (41.82 kg) | 59.6" (151.4 cm) |
| Teenage Girls (13-20 Years) | ||
| Age | Weight | Height |
| 13 Years | 101.4 lb (45.99 kg) | 61.9" (157.2 cm) |
| 14 Years | 109.1 lb (49.49 kg) | 63.2" (160.5 cm) |
| 15 Years | 114.9 lb (52.12 kg) | 63.7" (161.8 cm) |
| 16 Years | 118.9 lb (53.93 kg) | 64.0" (162.6 cm) |
| 17 Years | 121.7 lb (55.20 kg) | 64.1" (162.8 cm) |
| 18 Years | 124.0 lb (56.25 kg) | 64.2" (163.1 cm) |
| 19 Years | 126.4 lb (57.33 kg) | 64.3" (163.3 cm) |
| 20 Years | 128.4 lb (58.24 kg) | 64.3" (163.3 cm) |
Notes: The teenage figures are reference medians (the 50th percentile of the CDC growth charts), not measured averages of young people today. Actual measured averages in the United States run higher, particularly at the older ages, so the 20-year row should be read as the middle of the reference distribution rather than as the typical weight or height of a 20-year-old.
Weight rises by roughly 2 pounds between the 23-month row and the 2-year row. This is not a growth spurt — it is the point where the reference source changes, from the WHO Child Growth Standards (used from birth to 23 months) to the CDC growth charts (used from 2 to 20 years). The two references were built from different populations, so their medians do not align exactly at the join. The step is left in place rather than smoothed, because adjusting the figures would mean departing from the published standards.
Frequently Asked Questions
At what age do girls usually stop growing taller
Most girls reach their adult height around 14 to 16 years, generally within two to three years after their first period, once the growth plates close. The chart reflects this, with height changing very little after about age 16 while weight continues to rise slowly.
Why does the girls chart flatten in the mid teens while boys keep climbing
Girls typically start puberty about two years earlier than boys, so their peak growth spurt comes sooner and finishes sooner. Boys get extra years of childhood growth before their spurt begins, which is the main reason adult averages differ between the sexes.
How can I estimate my daughter's adult height
A common rough method takes the father's height in inches minus 5 inches, adds the mother's height, then divides by two. The result carries a margin of several inches, so a pediatrician reviewing her growth curve gives a more reliable projection.
What is the typical age for a girl's growth spurt and first period
The fastest growth usually happens between about 10 and 13 years, with the first period commonly arriving between 10 and 15 years in the United States. Growth slows markedly after menstruation begins, with only a few more inches typically gained.
How is BMI calculated and interpreted for girls
BMI is weight in kilograms divided by height in meters squared, but for anyone under 20 the result is compared with other girls the same age using BMI-for-age percentiles rather than adult cutoffs. Adult thresholds do not apply to children because normal body composition shifts throughout childhood.
Does early or late puberty change a girl's final adult height
Very early puberty can end growth sooner and reduce final height, while later puberty often allows more years of childhood growth. Signs of puberty before age 8, or no signs by age 13, are worth having evaluated.
How much sleep, calcium, and iron do growing girls need
School-age children generally need about 9 to 12 hours of sleep and teenagers about 8 to 10, since growth hormone peaks during deep sleep. Adolescent girls also have higher calcium needs for bone building and higher iron needs once menstruation starts.
Why is a girl measured lying down as a baby but standing later
Infants and toddlers cannot stand straight, so recumbent length is used until about age two, when standing height takes over. Standing height reads slightly shorter than length, which is one reason the earlier tables are labeled length and the later ones height.
How These Figures Were Derived and Last Verified
Every number in the table above is the median (50th percentile) of a published growth reference, not an average of site visitors or an in-house estimate. Figures from birth through 23 months come from the WHO Child Growth Standards, which the CDC recommends for children under two years of age in the United States. Figures from 2 through 20 years come from the CDC 2000 clinical growth charts, taken from the published weight-for-age and stature-for-age percentile data files. In each row the imperial and metric values are converted from the source figure in its original unit and rounded consistently, so the two unit systems agree with one another. The complete set of figures was last checked cell by cell against the source data files on 26 July 2026, and matches our full height-to-weight guide for infants through teens.
Source References
- 1 - World Health Organization: Child Growth Standards - overview of the standards used from birth to 23 months.
- 2 - World Health Organization: Weight-for-age - z-score and percentile tables, birth to 5 years.
- 3 - World Health Organization: Length/height-for-age - z-score and percentile tables, birth to 5 years.
- 4 - U.S. Centers for Disease Control and Prevention: WHO growth standards for use in US infants and children birth to 2 years - the basis for using WHO figures below age two.
- 5 - U.S. Centers for Disease Control and Prevention: Growth Charts - main resource page.
- 6 - U.S. Centers for Disease Control and Prevention: Percentile Data Files with LMS Values - the weight-for-age and stature-for-age files used for ages 2 to 20 years.
Other Printable Height to Weight Reference Charts:
Insights, Analysis, and Developments
Editorial Note: Growth charts like these serve as guideposts rather than rigid benchmarks, since every child develops at their own pace influenced by genetics, nutrition, activity levels, and health status. Parents and caregivers should remember that measurements falling outside average ranges don't automatically signal problems, though consistent tracking does help identify patterns worth discussing with pediatricians. For families raising children with chronic conditions, genetic differences, or physical disabilities, these charts become especially practical tools during medical appointments, helping healthcare teams spot concerning trends early while distinguishing between typical variation and changes requiring clinical attention or intervention.
 Author Credentials: Ian C. Langtree is a writer, editor, and the founder and Editor-in-Chief of Disabled World, which he established in 2004 as one of the longest-running independent resources for disability news and information. Over more than two decades, he has written and edited thousands of articles on disability rights, health, accessibility, and assistive technology. Drawing on a global perspective shaped by extensive travel and lived experience, Ian is a committed advocate of the Social Model of Disability, the framework developed by disabled activists in the 1970s that focuses on removing societal barriers rather than on individual impairments. His writing is grounded in that framework and in a lasting commitment to disability rights, accessibility, and social inclusion. To learn more about Ian's background, expertise, and accomplishments, visit his full biography.