Boys Height Weight Chart Birth to 20 Years Printable
Author: Ian C. Langtree - Writer/Editor for Disabled World (DW)
Published: 21 Aug 2023 - Updated: 10 Jul 2026
Publication Type: Charts, Graphs, Tables
Table of Contents:
Synopsis - Definition - Overview - FAQs - Insights, Updates - Related Content
Synopsis
This resource provides a detailed reference chart for monitoring male growth patterns from infancy through young adulthood. Healthcare providers, parents, and caregivers rely on these standardized measurements to assess whether a child's physical development falls within typical ranges for his age group. The data becomes particularly valuable when tracking boys through adolescence, when growth spurts can create temporary variations from average measurements. Since each boy develops at his own pace, the chart serves as a guideline rather than a rigid standard, helping identify when growth patterns might warrant professional medical evaluation. The printable format makes it practical for home use or clinical settings where quick reference to age-specific height and weight norms is needed.At a Glance
- 1 - Average birth measurements are 7.4 lb (3.3 kg) and 19.6" (49.8 cm).
- 2 - Boys reach roughly 155 lb (70.3 kg) and 69.7" (177 cm) by age 20.
- 3 - Chart data is sourced from the World Health Organization, the National Institutes of Health, and the U.S. Centers for Disease Control and Prevention.
Topic Definition
- Boys Growth Chart
A boys growth chart is a standardized reference tool that maps the average height and weight of male children at each stage of development, from newborns through age twenty. Pediatricians, parents, and caregivers use it to gauge whether a boy's physical development falls within typical ranges for his age, making it easier to see healthy progress or spot changes that may call for a closer look. It works best as a guideline rather than a strict standard, since boys grow at their own pace and adolescent growth spurts can create temporary swings above or below the average. The chart is especially handy during medical visits and for tracking children with disabilities or chronic conditions, where steady monitoring helps healthcare teams separate normal variation from trends that deserve professional evaluation.
Overview
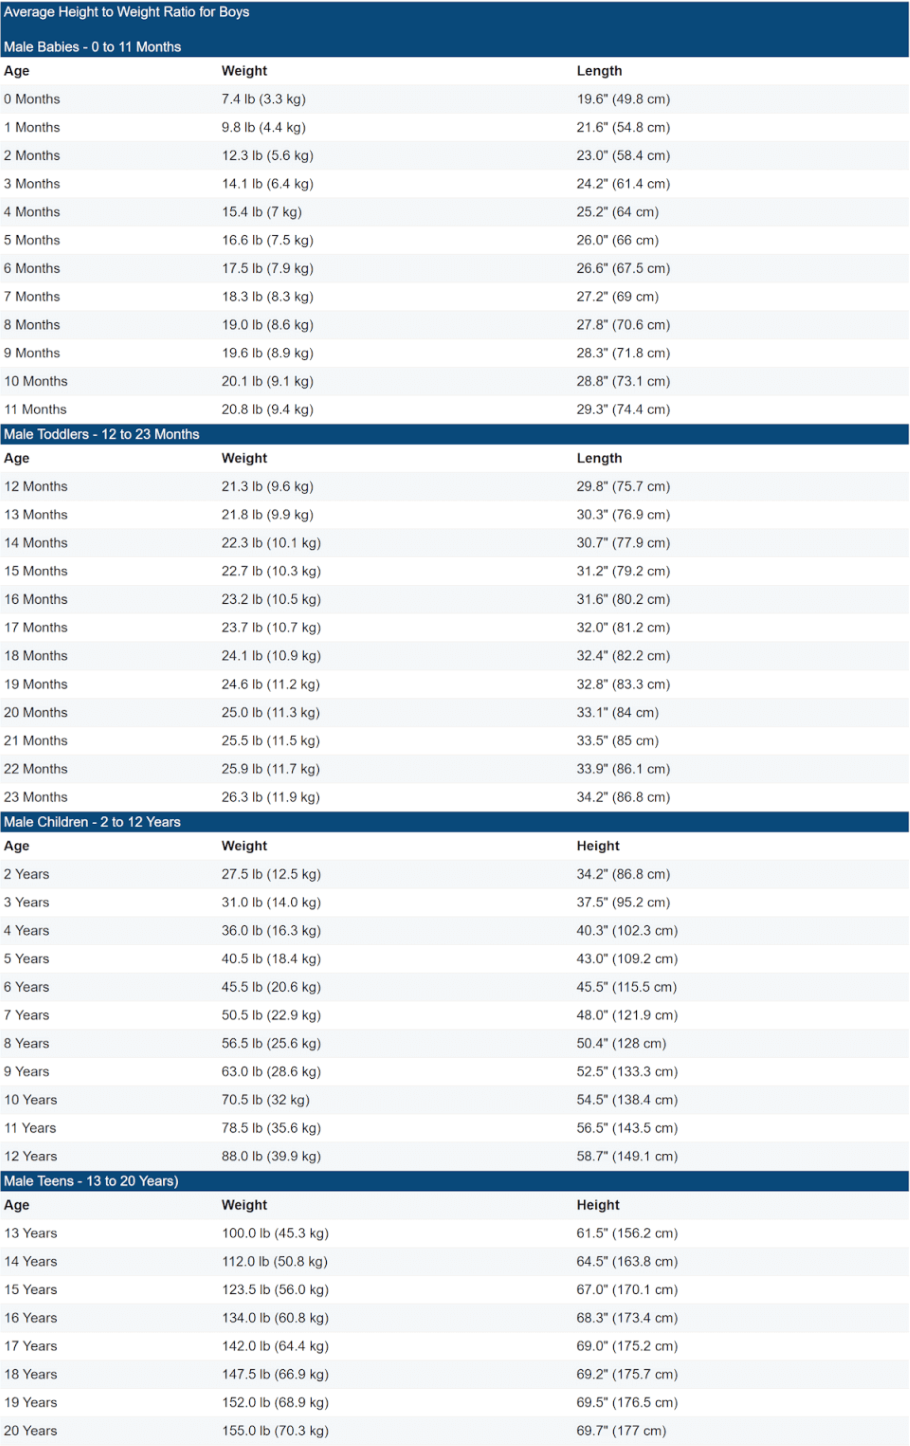
Our printable chart below forms part of our average height to weight chart - babies to teenagers page, and outlines the average weight to height scale for males aged from birth to 20 years old. Normal growth is categorized in a range used by pediatricians to gauge how a child is growing.
| Age | Weight | Length |
|---|---|---|
| Birth | 7.4 lb (3.3 kg) | 19.6" (49.8 cm) |
| 1 Month | 9.8 lb (4.4 kg) | 21.6" (54.8 cm) |
| 2 Months | 12.3 lb (5.58 kg) | 23.0" (58.4 cm) |
| 3 Months | 14.1 lb (6.4 kg) | 24.2" (61.4 cm) |
| 4 Months | 15.4 lb (7 kg) | 25.2" (64 cm) |
| 5 Months | 16.6 lb (7.53 kg) | 26.0" (66 cm) |
| 6 Months | 17.5 lb (7.94 kg) | 26.6" (67.5 cm) |
| 7 Months | 18.3 lb (8.3 kg) | 27.2" (69 cm) |
| 8 Months | 19.0 lb (8.62 kg) | 27.8" (70.6 cm) |
| 9 Months | 19.6 lb (8.9 kg) | 28.3" (71.8 cm) |
| 10 Months | 20.1 lb (9.12 kg) | 28.8" (73.1 cm) |
| 11 Months | 20.8 lb (9.43 kg) | 29.3" (74.4 cm) |
| Toddler Boys (12-23 Months) | ||
| Age | Weight | Length |
| 12 Months | 21.3 lb (9.66 kg) | 29.8" (75.7 cm) |
| 13 Months | 21.8 lb (9.89 kg) | 30.3" (76.9 cm) |
| 14 Months | 22.3 lb (10.12 kg) | 30.7" (77.9 cm) |
| 15 Months | 22.7 lb (10.3 kg) | 31.2" (79.2 cm) |
| 16 Months | 23.2 lb (10.52 kg) | 31.6" (80.2 cm) |
| 17 Months | 23.7 lb (10.75 kg) | 32.0" (81.2 cm) |
| 18 Months | 24.1 lb (10.93 kg) | 32.4" (82.2 cm) |
| 19 Months | 24.6 lb (11.16 kg) | 32.8" (83.3 cm) |
| 20 Months | 25.0 lb (11.34 kg) | 33.1" (84 cm) |
| 21 Months | 25.5 lb (11.57 kg) | 33.5" (85 cm) |
| 22 Months | 25.9 lb (11.75 kg) | 33.9" (86.1 cm) |
| 23 Months | 26.3 lb (11.93 kg) | 34.2" (86.8 cm) |
| Boys Ages 2-12 | ||
| Age | Weight | Height |
| 2 Years | 27.5 lb (12.47 kg) | 34.2" (86.8 cm) |
| 3 Years | 31.0 lb (14.06 kg) | 37.5" (95.2 cm) |
| 4 Years | 36.0 lb (16.33 kg) | 40.3" (102.3 cm) |
| 5 Years | 40.5 lb (18.37 kg) | 43.0" (109.2 cm) |
| 6 Years | 45.5 lb (20.64 kg) | 45.5" (115.5 cm) |
| 7 Years | 50.5 lb (22.9 kg) | 48.0" (121.9 cm) |
| 8 Years | 56.5 lb (25.63 kg) | 50.4" (128 cm) |
| 9 Years | 63.0 lb (28.58 kg) | 52.5" (133.3 cm) |
| 10 Years | 70.5 lb (32 kg) | 54.5" (138.4 cm) |
| 11 Years | 78.5 lb (35.6 kg) | 56.5" (143.5 cm) |
| 12 Years | 88.0 lb (39.92 kg) | 58.7" (149.1 cm) |
| Teenage Boys (13-20 Years) | ||
| Age | Weight | Height |
| 13 Years | 100.0 lb (45.36 kg) | 61.5" (156.2 cm) |
| 14 Years | 112.0 lb (50.8 kg) | 64.5" (163.8 cm) |
| 15 Years | 123.5 lb (56.02 kg) | 67.0" (170.1 cm) |
| 16 Years | 134.0 lb (60.78 kg) | 68.3" (173.4 cm) |
| 17 Years | 142.0 lb (64.41 kg) | 69.0" (175.2 cm) |
| 18 Years | 147.5 lb (66.9 kg) | 69.2" (175.7 cm) |
| 19 Years | 152.0 lb (68.95 kg) | 69.5" (176.5 cm) |
| 20 Years | 155.0 lb (70.3 kg) | 69.7" (177 cm) |
Printable Chart
To print the above chart click "File" and then "Print". Or, use a keyboard shortcut:
Mac: Command-key + p
Windows and Linux: Ctrl + p
In the window that appears, select the destination and change your preferred print settings.
Click "Print".
Other Printable Height to Weight Reference Charts:
*Information and data for above growth charts sourced from The World Health Organization (WHO), Gerontology Research Center (National Institutes of Health (NIH), USA), and the U.S. Centers for Disease Control and Prevention (CDC).
Frequently Asked Questions
What is a healthy weight range for boys at each age?
There is no single healthy weight, since it depends on height, build, and stage of development. The averages on a growth chart give a useful starting point, but a pediatrician can determine whether a boy's numbers are healthy for his individual body.
How often should I measure my son's height and weight?
Infants are usually measured at each scheduled well-child visit, while older boys are often measured about once a year. A doctor may recommend more frequent checks if there is a specific growth or health concern being monitored.
Do boys and girls follow different growth patterns?
Yes, boys and girls tend to grow at different rates and reach growth milestones at different ages, which is why separate charts are used for each. Boys often show later but more pronounced adolescent growth spurts, leading to taller and heavier averages by age twenty.
Should I be worried if my son is above or below the average?
Falling outside the average does not automatically indicate a problem, as boys naturally come in many shapes and sizes. Consistent growth along his own curve matters more than matching a specific number, though sudden shifts are worth discussing with a pediatrician.
Why do teenage boys show such large jumps in the chart?
Puberty triggers rapid growth spurts that can add significant height and weight over a short period. This is why the teenage rows on the chart change more dramatically than the earlier childhood years.
Can medications or medical conditions affect a boy's growth?
Yes, certain medications, chronic illnesses, and genetic or physical conditions can influence how a boy grows. Regular tracking in these cases helps healthcare teams detect concerning trends early and respond appropriately.
Insights, Analysis, and Developments
Editorial Note: While these measurements represent statistical averages derived from large population studies, parents should remember that healthy boys come in many different sizes and shapes. A child who falls outside these ranges isn't necessarily facing a health concern, especially if he's growing consistently along his own curve. What matters most is steady progress over time rather than matching a specific number at a given age. Still, significant deviations or sudden changes in growth patterns deserve attention from a pediatrician, who can evaluate the whole picture of a child's health, family genetics, nutrition, and overall development. This chart works best as one tool among many for understanding how a boy is growing, not as a definitive measure of his health or potential. Author Credentials: Ian is the founder and Editor-in-Chief of Disabled World, a leading resource for news and information on disability issues. With a global perspective shaped by years of travel and lived experience, Ian is a committed proponent of the Social Model of Disability-a transformative framework developed by disabled activists in the 1970s that emphasizes dismantling societal barriers rather than focusing solely on individual impairments. His work reflects a deep commitment to disability rights, accessibility, and social inclusion. To learn more about Ian's background, expertise, and accomplishments, visit his full biography.